
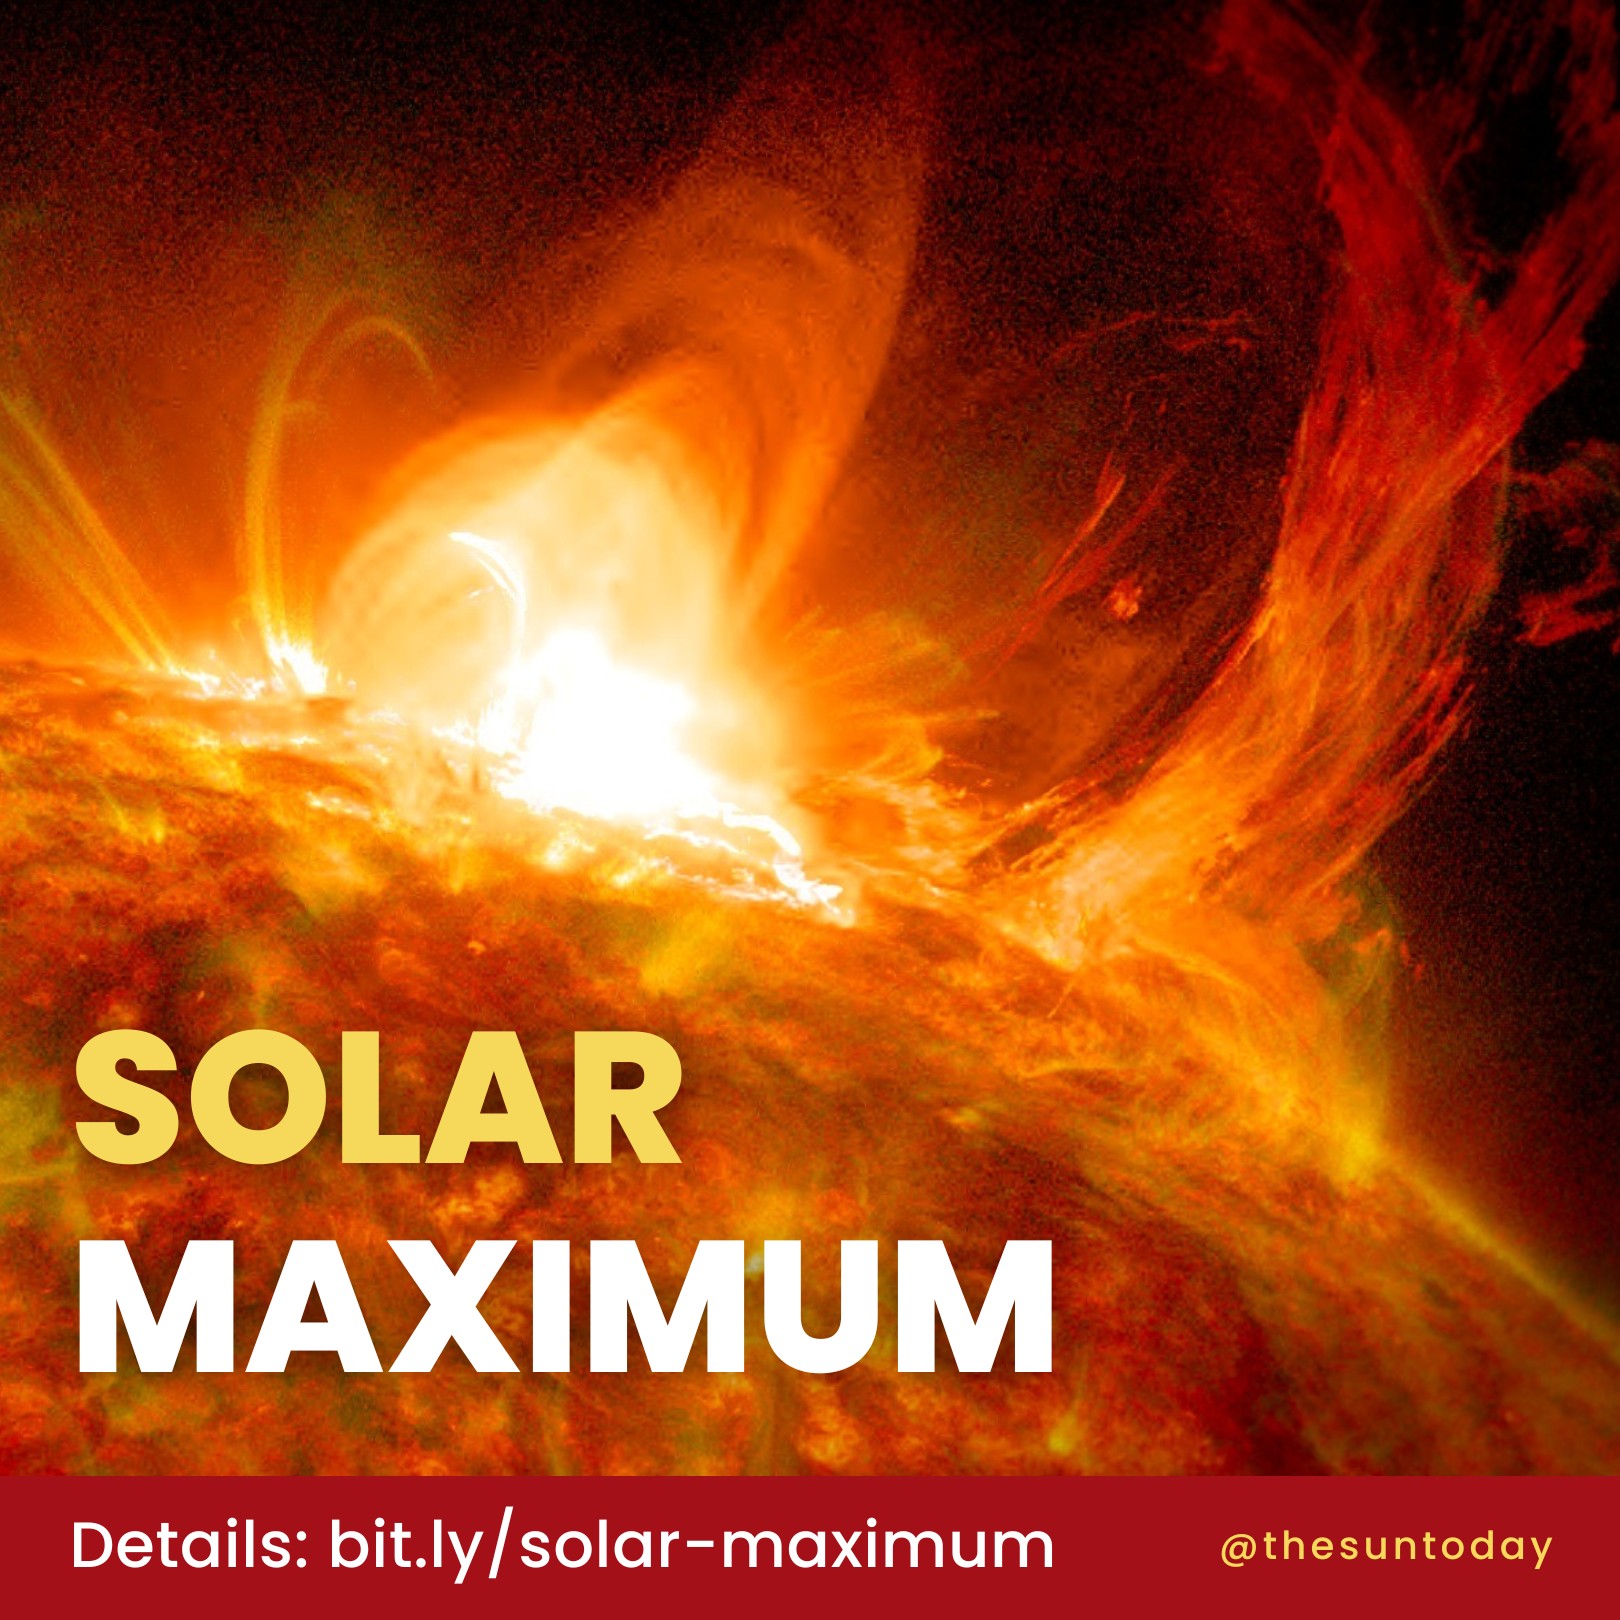
Solar maximum, often shortened to solar max, is the period when the Sun’s activity, such as solar flares and coronal mass ejections, reaches its highest frequency and intensity. It was reached in 2024.
It is also when the number and size of sunspots on the Sun are greatest. Solar maximum occurs roughly every 11 years.
The Solar Cycle
The Sun is currently in Solar Cycle 25.
First, we need to talk about a cycle of the Sun, which is called the solar activity or sunspot cycle. Over a roughly 11-year period, the Sun changes from a time of solar minimum to solar maximum back to solar minimum. Sometimes, this up-down cycle can last slightly longer than 11 years and sometimes slightly shortly, but on average, it is about 11 years.
At the start of the cycle, solar minimum, the Sun has very few or even no sunspots in its visible layer called the photosphere. This corresponds to the layer that provides the light we recieve from the Sun. As time progresses and the Sun starts to head toward solar maximum, we begin to see more sunspots and explosive activity such as solar flares, coronal mass ejections (CMEs), and solar energetic particles.
What is solar activity?
The Sun’s activity is based on four basic phenomena:
- Solar wind
- Solar flares
- Coronal mass ejections (CMEs)
- Solar energetic particles (SEPs)
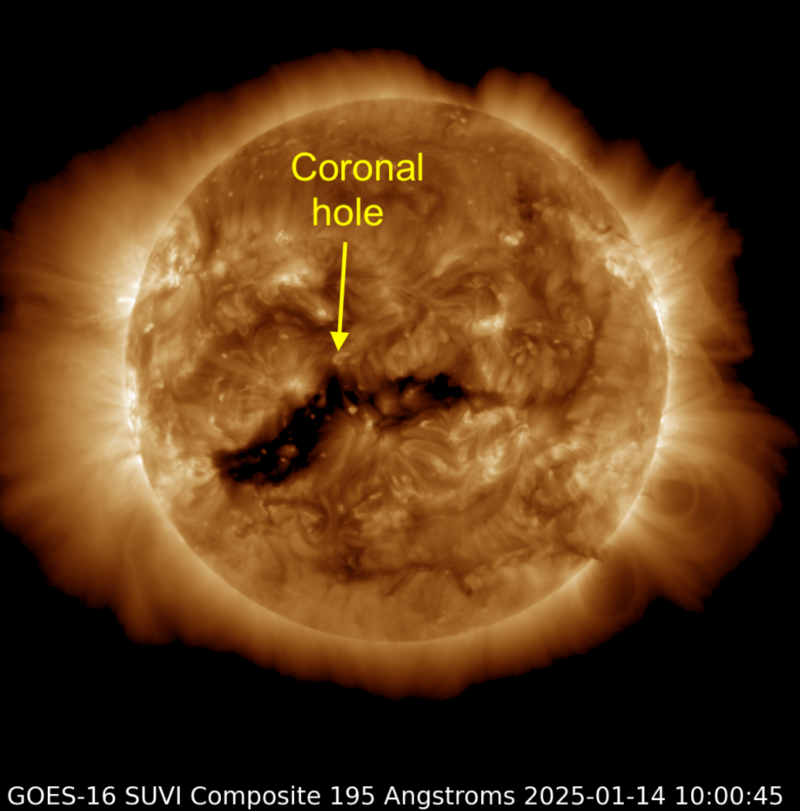
Because of the Sun’s superhot outer atmosphere, the corona, solar particles, and magnetic field stream away in a dynamic and turbulent flow called the solar wind. The average background solar wind comes from across the Sun. A fast component of the solar wind originates in coronal holes.
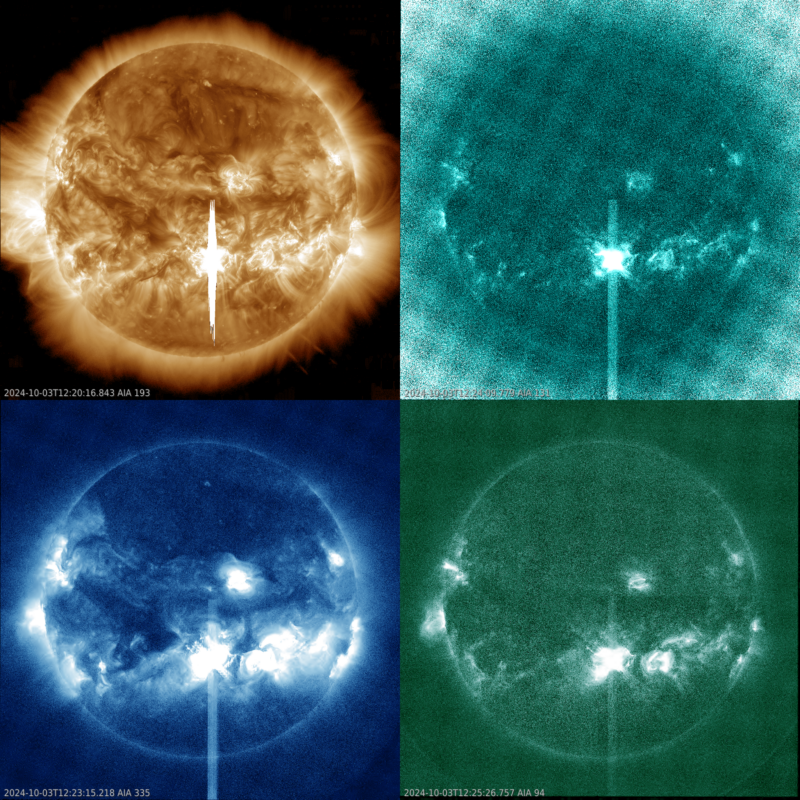
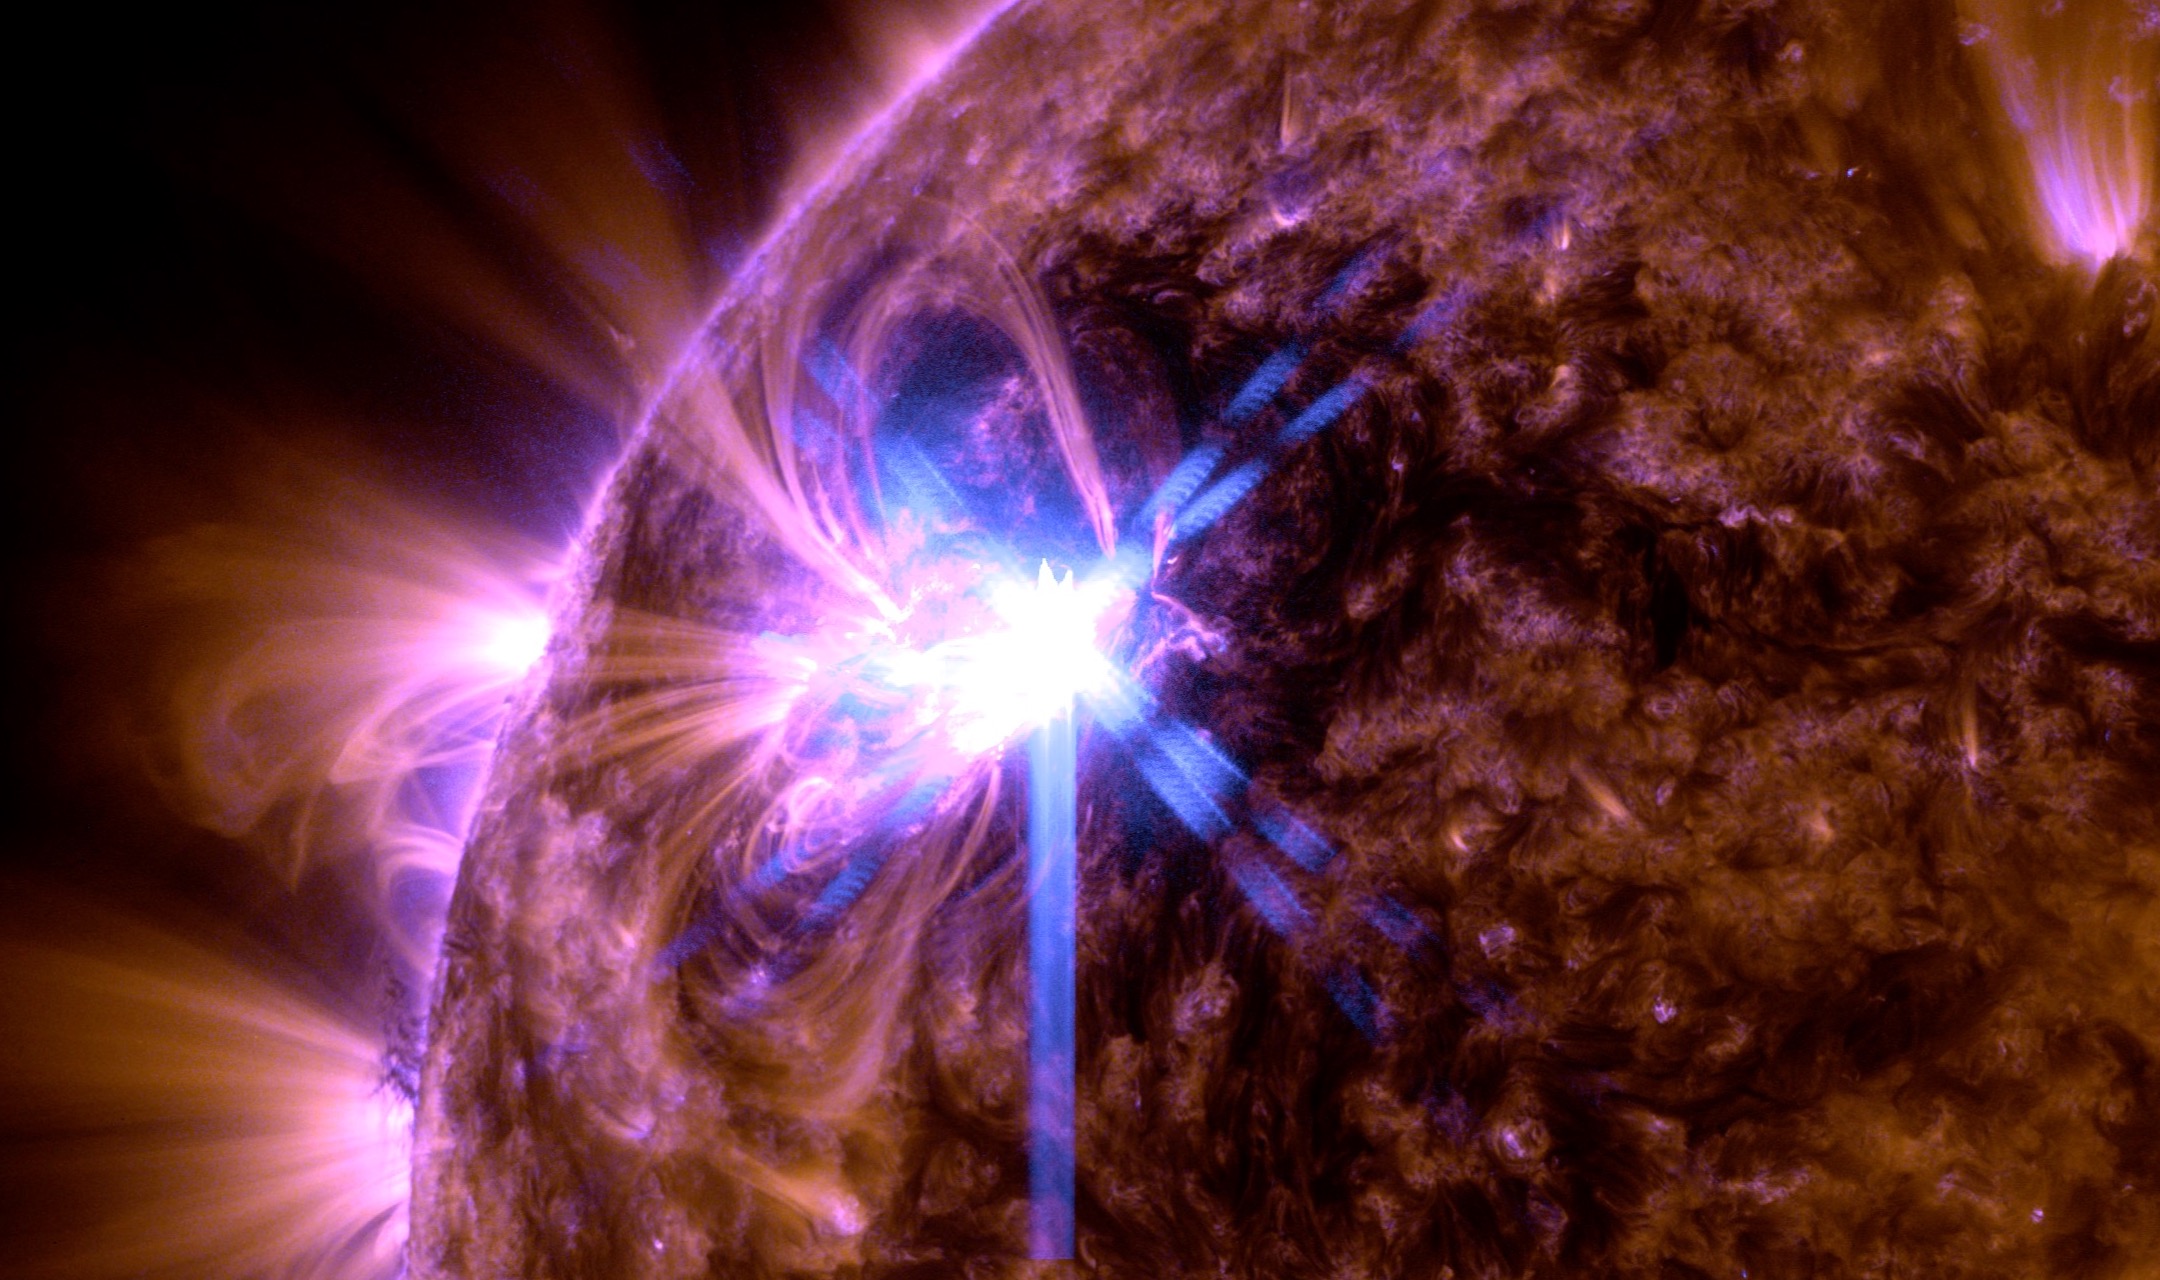
On October 3, 2024, sunspot region AR3842 released an X9 flare starting at 12:08 UTC, peaking at 12:18 UTC. Image via SDO and jhelioviewer
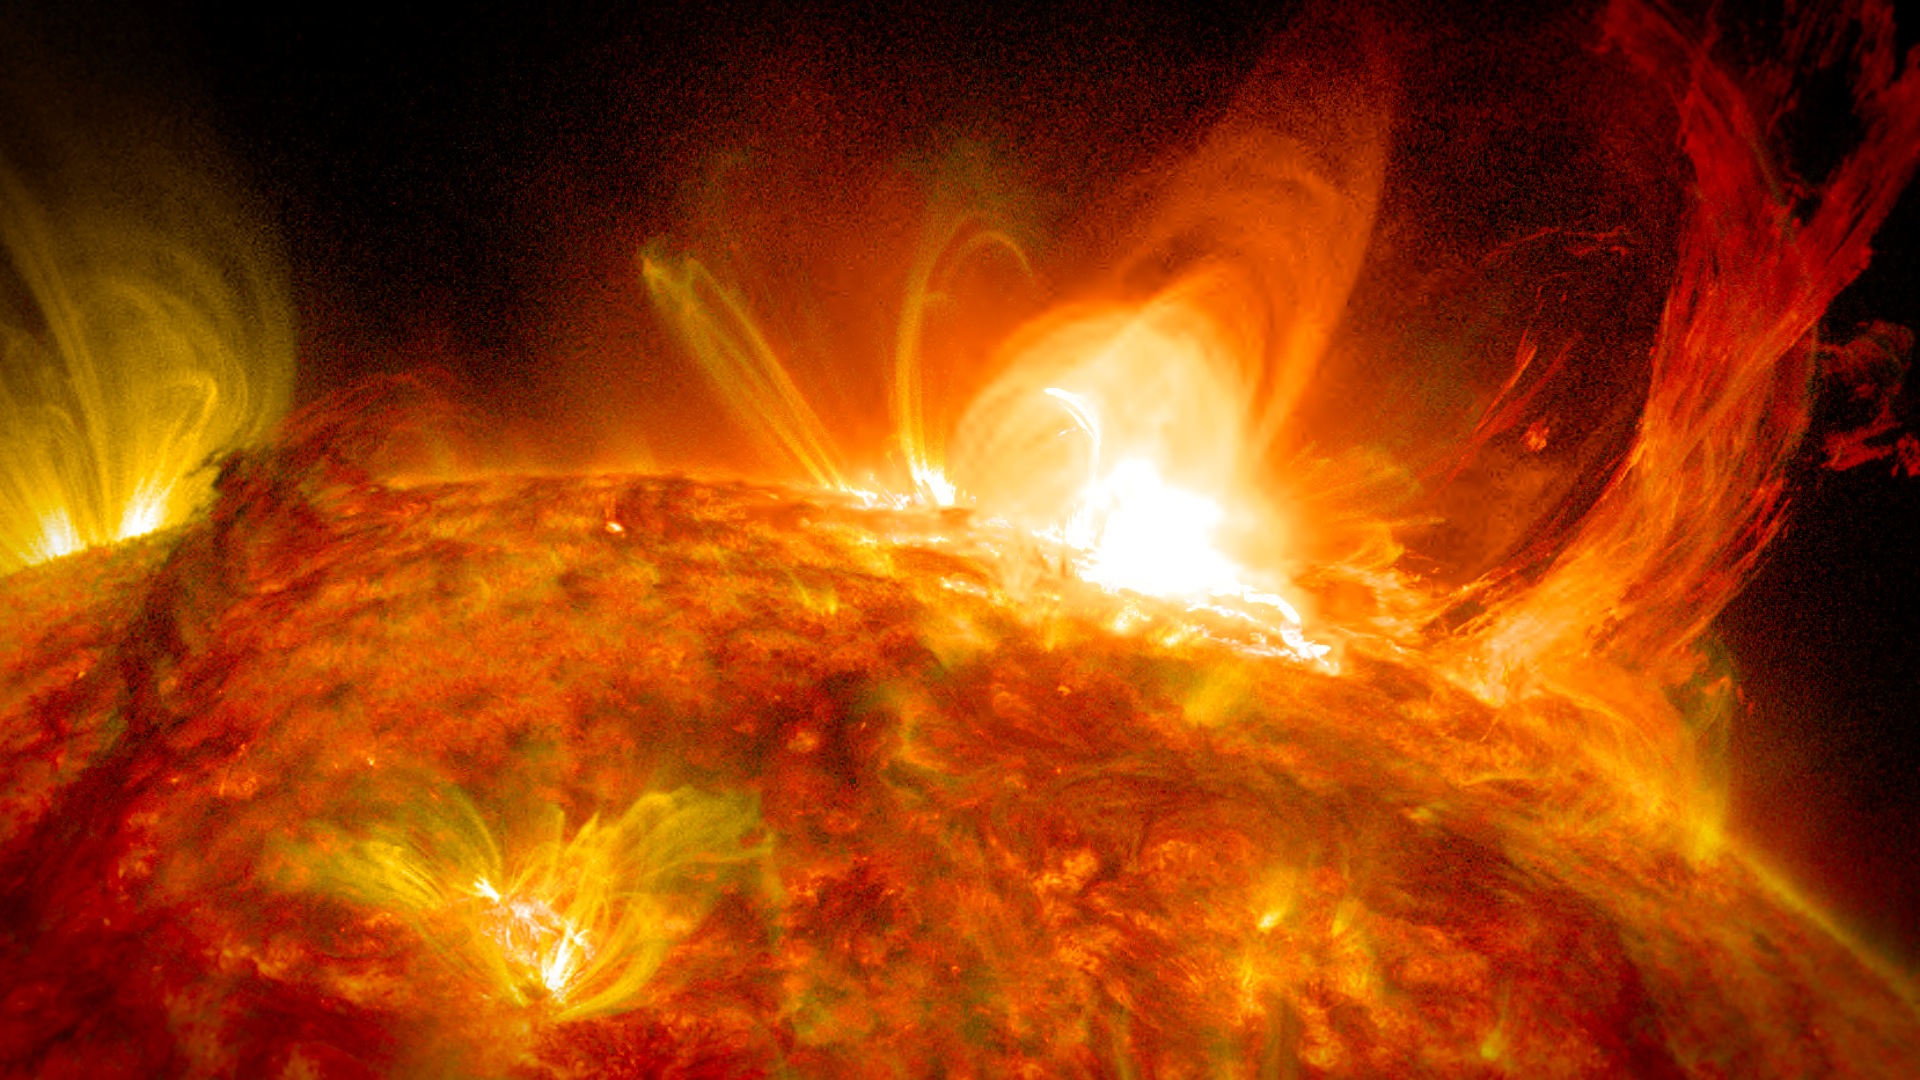
Solar flares are rapid energy releases from a localized region (usually sunspots) on the Sun through electromagnetic radiation, energetic particles, and mass motions.
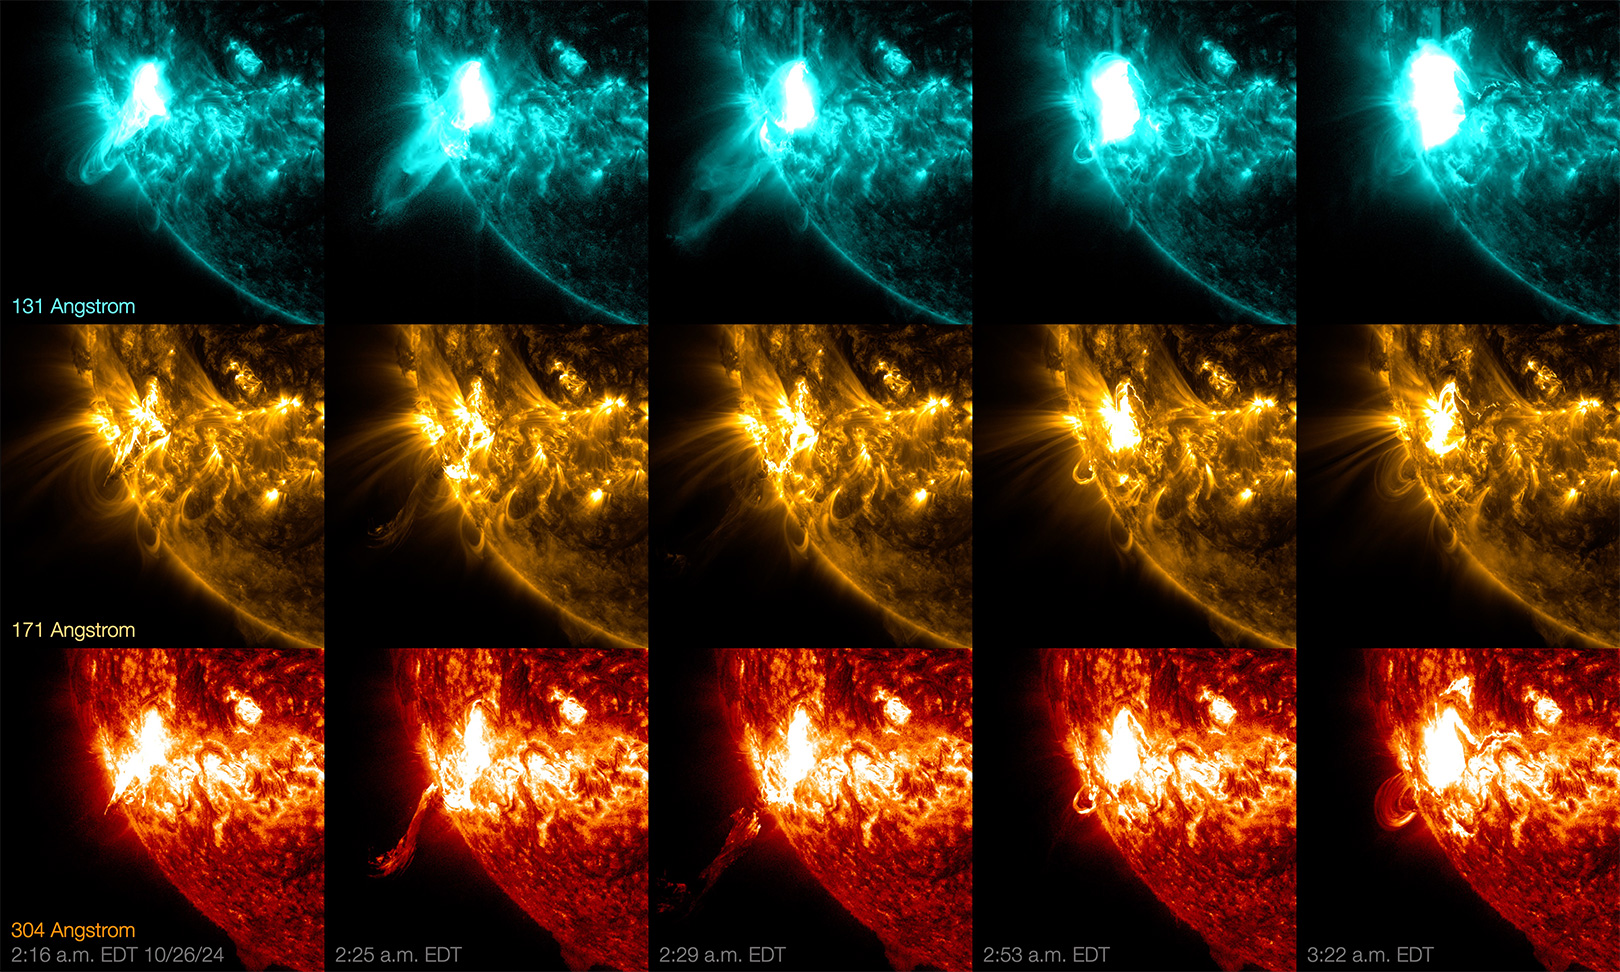
A sequence of October 26th’s X1.8-class solar flare viewed in three different wavelengths of extreme ultraviolet light captured by NASA’ Solar Dynamics Observatory. AIA 171 (colorized here in gold) shows solar material at just over 1 million degrees Fahrenheit. AIA 131 (colorized here in teal) shows solar material at up to a blistering 18 million degrees Fahrenheit, AIA 304 (colorized here in red) shows material at around 100,000 degrees Fahrenheit. Credit:NASA/SDO
TOP 10 Solar Flares in Solar Cycle 25
| # | Solar Flare Size | Date | Active or Sunspot Region | Start TIme (UTC) | Maximum | End Time | Archive |
|---|---|---|---|---|---|---|---|
| 1 | X9 | 2024/10/03 | 3842 | 12:08 | 12:18 | 12:27 | |
| 2 | X8.79 | 2024/05/14 | 3664 | 16:46 | 16:51 | 17:02 | |
| 3 | X7.1 | 2024/10/01 | 3842 | 21:58 | 22:20 | 22:29 | |
| 4 | X6.37 | 2024/02/22 | 3590 | 22:08 | 22:34 | 22:43 | |
| 5 | X5.89 | 2024/05/11 | 3664 | 01:10 | 01:23 | 01:39 | |
| 6 | X5.01 | 2023/12/31 | 3536 | 21:36 | 21:55 | 22:08 | |
| 7 | X4.54 | 2024/09/14 | 3825 | 15:13 | 15:29 | 15:47 | |
| 8 | X4.52 | 2024/05/06 | 3663 | 05:38 | 06:35 | 06:47 | |
| 9 | X3.98 | 2024/05/10 | 3664 | 06:27 | 06:54 | 07:06 | |
| 10 | X3.48 | 2024/05/15 | 3664 | 08:18 | 08:37 | 08:52 | |
| 11 | X3.38 | 2024/02/09 | 3575 | 12:53 | 13:14 | 13:32 |
A coronal mass ejection (CME) is a giant magnetic bubble of plasma that erupts from the Sun’s corona and travels through space at a high speed, on the order of millions of kilometers per hour. When CMEs impact Earth’s magnetic field, a magnetic disturbance is created, which, when strong enough, is called a geomagnetic storm. Geomagnetic storms are also the origin of auroras.
TOP 10 Geomagnetic Storms in Solar Cycle 25
| # | Date | Dst | Ap | Kp max | Speed | IMF Bt | IMF Bz |
|---|---|---|---|---|---|---|---|
| 1 | 2024/05/11 | -412nT | 271 | 9 | 993.2km/sec | 55.75nT | -50.06nT |
| 2 | 2024/05/10 | -351nT | 105 | 9- | 804.7km/sec | 73.76nT | -49.96nT |
| 3 | 2024/10/11 | -335nT | 116 | 8+ | 813.9km/sec | 40.51nT | -37.60nT |
| 4 | 2024/10/10 | -299nT | 97 | 9- | 832.8km/sec | 45.97nT | -45.81nT |
| 5 | 2023/04/24 | -213nT | 72 | 8 | 635.7km/sec | 34.66nT | -33.32nT |
| 6 | 2024/08/12 | -203nT | 127 | 8 | 533.6km/sec | 23.33nT | -20.37nT |
| 7 | 2023/11/05 | -172nT | 61 | 7+ | 534.6km/sec | 44.71nT | -26.73nT |
| 8 | 2023/04/23 | -165nT | 65 | 8+ | 880.8km/sec | 31.11nT | -24.45nT |
| 9 | 2023/03/24 | -163nT | 73 | 8 | 499.4km/sec | 20.39nT | -15.92nT |
| 10 | 2024/05/12 | -159nT | 53 | 7 | 1005.0km/sec | 12.22nT | -8.54nT |
Both solar flares and CMEs can create shock waves that accelerate solar particles such as protons and electrons to near the speed of light. These are called solar energetic particles (SEPs) or Solar Proton Events (SPEs); when they are strong enough to reach Earth, they are called solar particle storms.
TOP 10 Solar Energetic Particle or Solar Proton Events in Solar Cycle 25
| # | Date | S-scale | Peak intensity |
|---|---|---|---|
| 1 | 2024/10/10 | S3 – Strong | 1811.953 |
| 2 | 2024/10/09 | S3 – Strong | 1143.644 |
| 3 | 2024/06/08 | S3 – Strong | 1028.531 |
| 4 | 2024/03/23 | S2 – Moderate | 955.735 |
| 5 | 2024/03/24 | S2 – Moderate | 724.578 |
| 6 | 2023/07/18 | S2 – Moderate | 619.653 |
| 7 | 2024/10/28 | S2 – Moderate | 363.729 |
| 8 | 2024/10/27 | S2 – Moderate | 273.151 |
| 9 | 2024/10/29 | S2 – Moderate | 229.683 |
| 10 | 2024/05/10 | S2 – Moderate | 206.919 |
Solar Activity Example
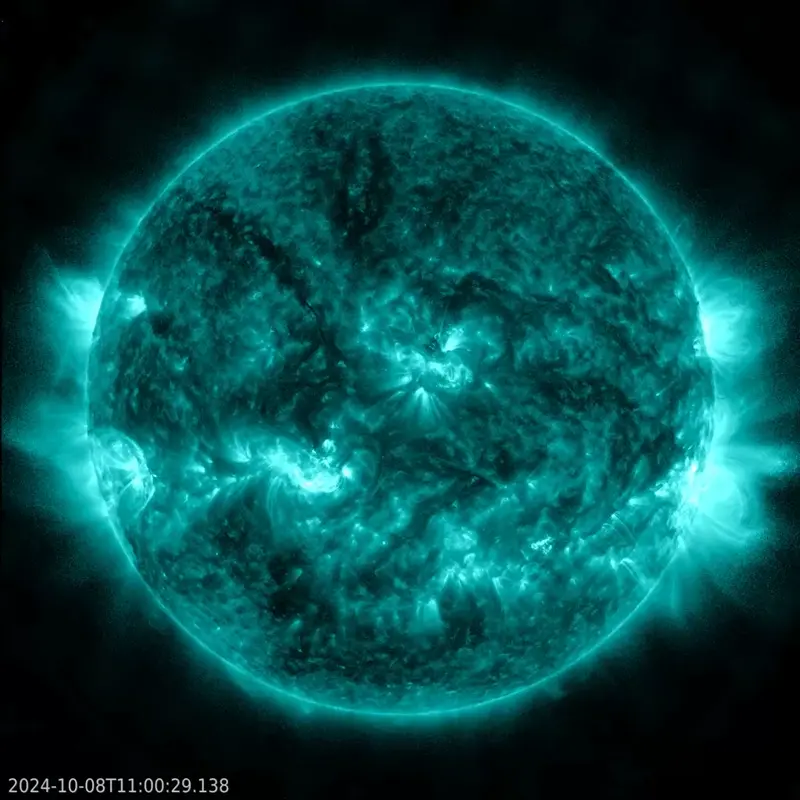
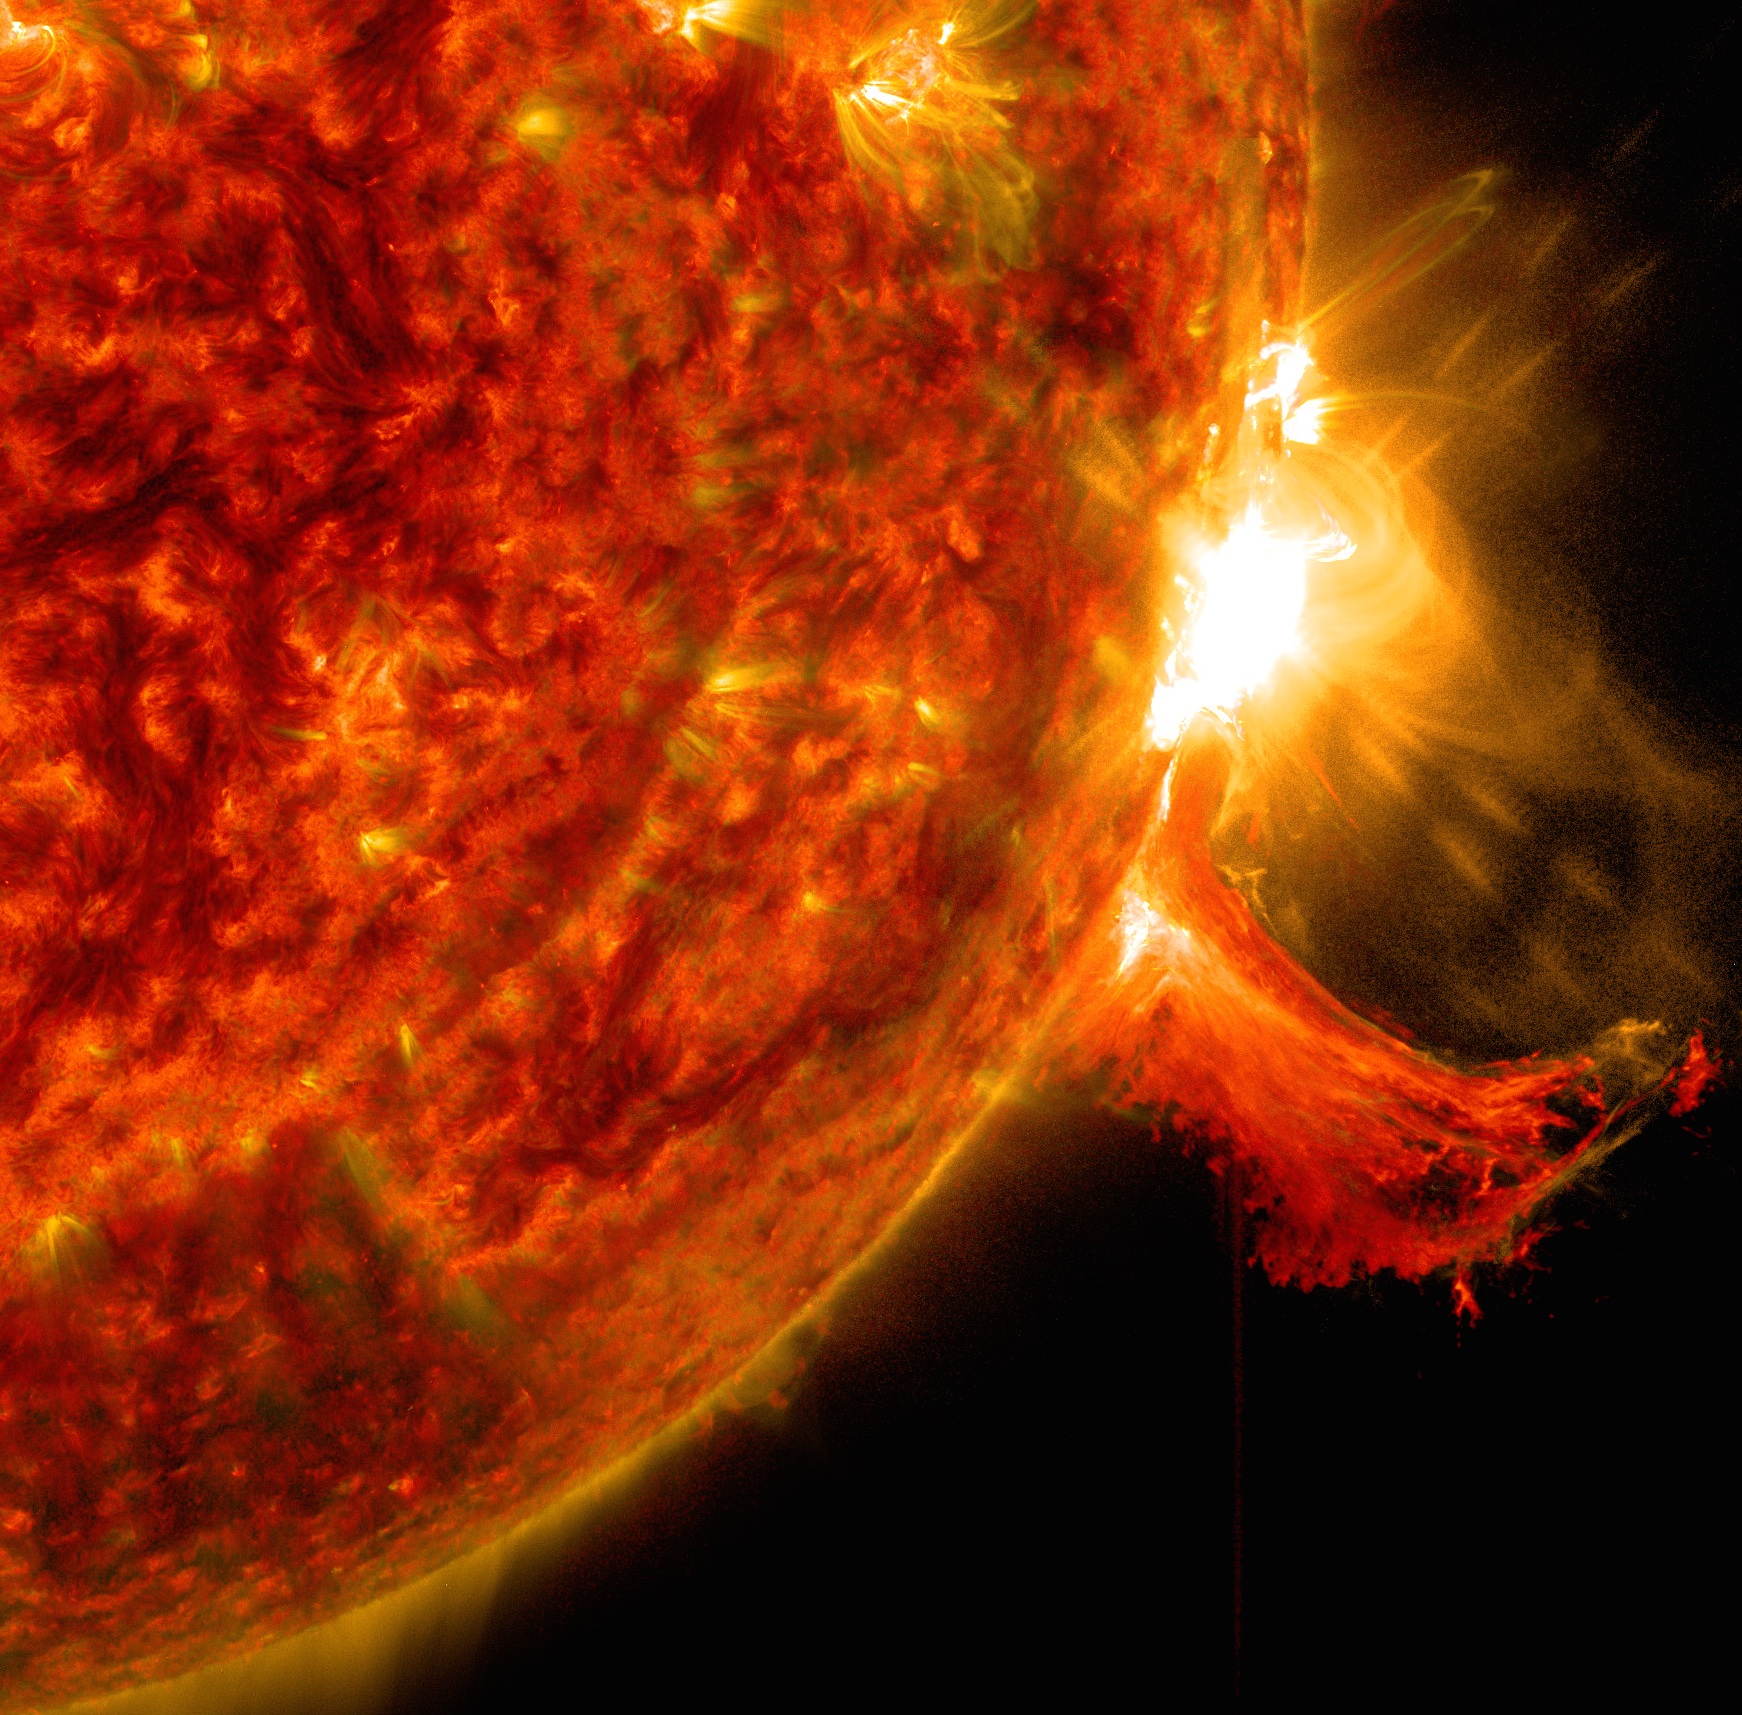
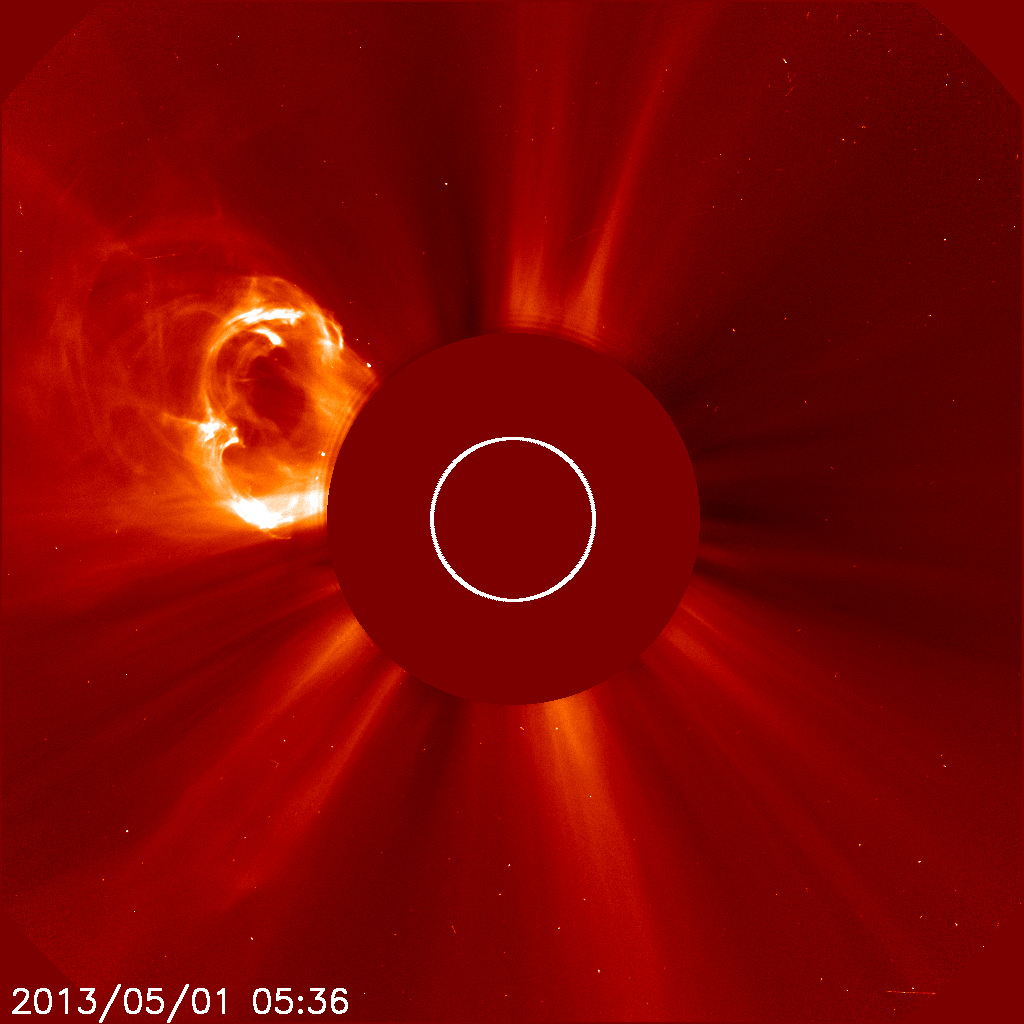
Sunspot region AR3848 released a large (X1.8) solar flare from near the center of the solar disk on October 8, 2024. This is observed in a teal image of extreme ultraviolet light as a bright flash.
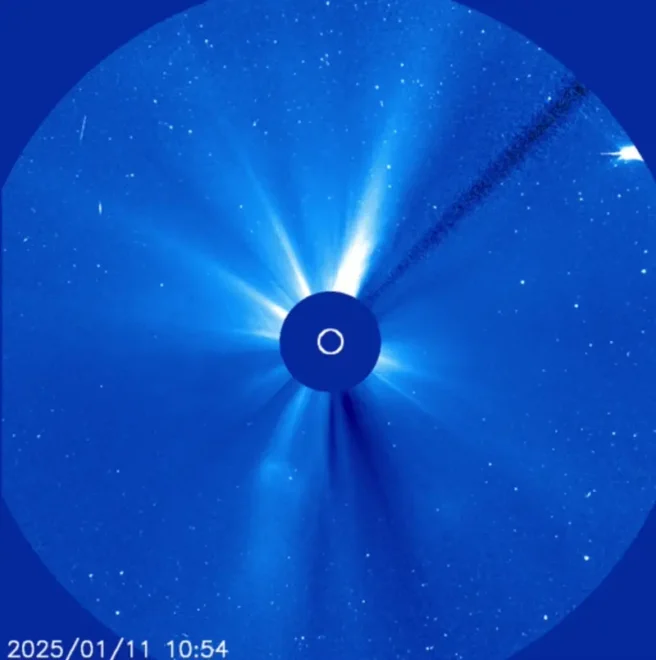
A CME appears as a huge (ring-shaped) cloud of solar material and magnetic field seen in a telescope that creates an artificial eclipse (a coronagraph). This CME created a shock wave that accelerated solar particles, creating a SEP and causing a solar particle storm at Earth. They appear as snow on the coronagraph images, and these solar energetic particles hit the camera.
A great example of solar activity near the peak of Solar Cycle 25. Images via jhelioviewer, SDO, SOHO
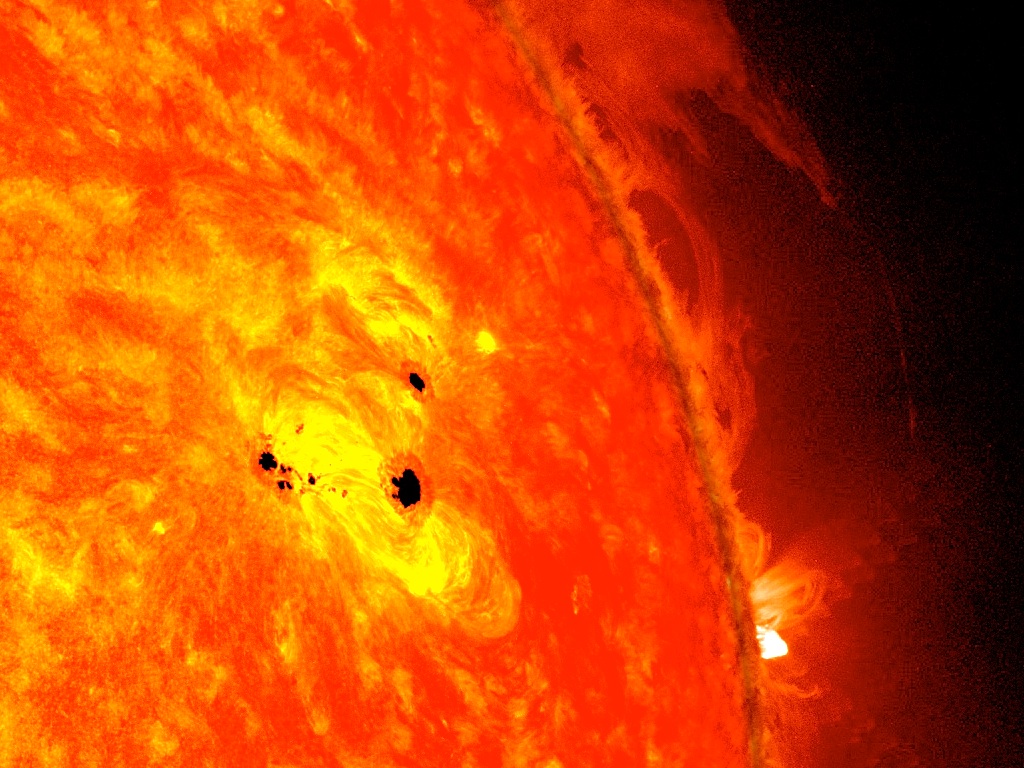
Sunspots
When we reach solar maximum, the Sun has the most sunspots, and the sunspots typically grow to much bigger sizes.
They can also get more uneven and complicated than just a simple round spot. These sunspots are made of concentrations of very strong magnetic fields and are also where a lot of the explosive activity originates.
The larger and more complicated the sunspots, the more of this explosive activity and the stronger the activity. Solar maximum is not a single point or day in time but a period of roughly a year during which the average number of sunspots is at its peak.
Sunspots over time
If we look at the sunspot number over time, the up-and-down nature of the solar cycle becomes very apparent.
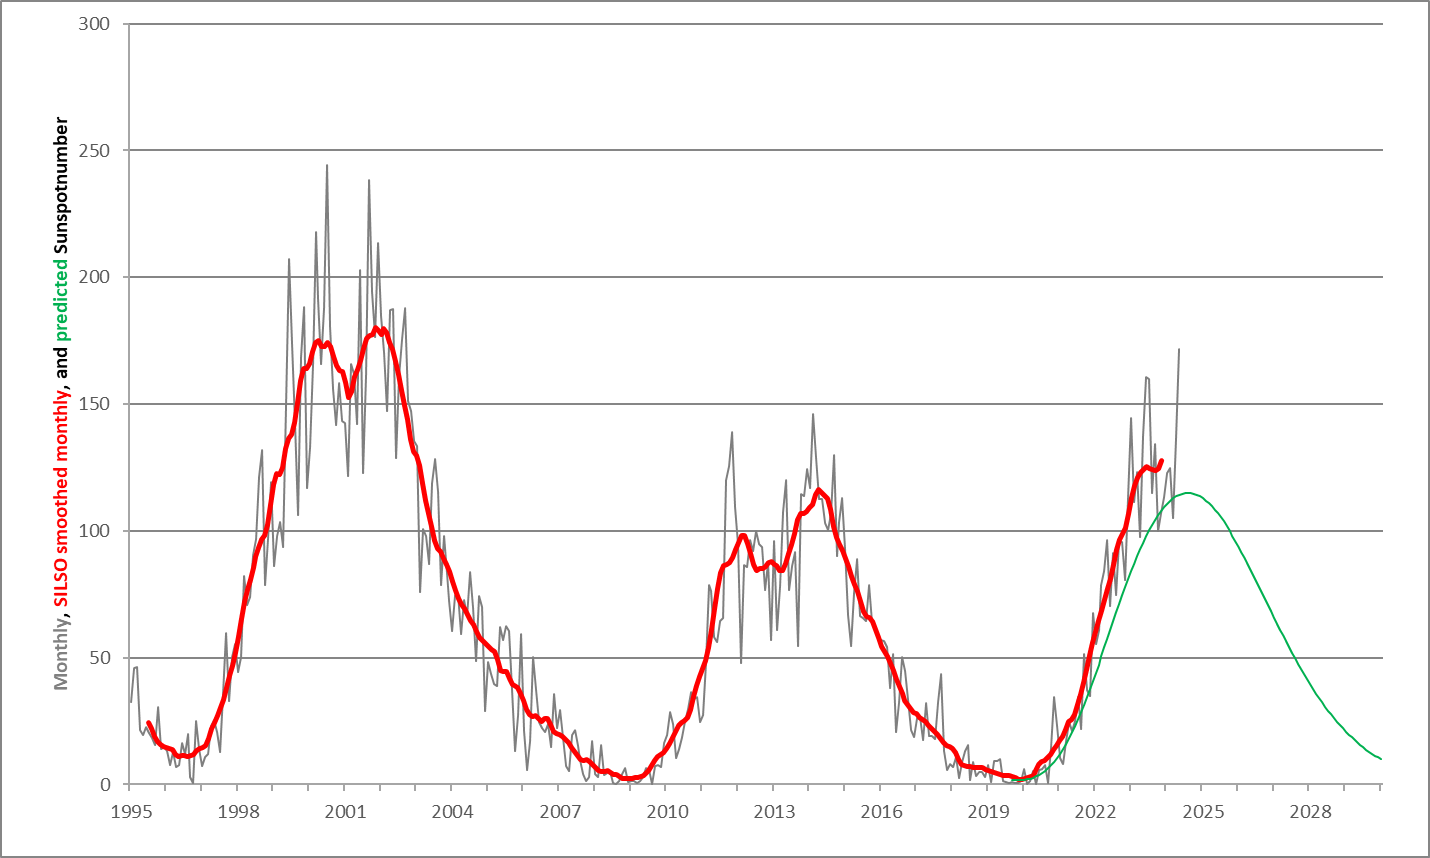
Image via stce.be.
The wiggly up-and-down gray line is the daily sunspot number. The red line is the monthly average, and the green line is the original prediction for the current sunspot cycle made in 2019.
We can see that the red line is far above the green prediction, meaning that the current solar cycle is larger than expected, but it also looks like the peak is coming much earlier. This means that the current solar maximum is much sooner than first expected. The red line has not definitively started going down, but we are close to or maybe even at the peak.
Solar cycles are labeled with a number.
The current solar cycle is Cycle 25, meaning there are 24 complete cycles, and the 25th is still happening.
We started counting these cycles around 400 years ago. The Sun has been around much longer than that, 4.6 billion years, and there have been solar cycles during that entire time. We only started counting sunspots regularly and consistently, starting with Cycle 1.
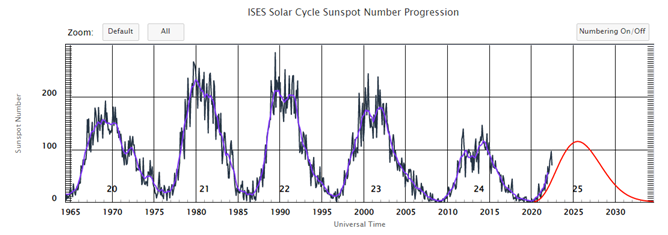
Image via NOAA and esa.int
If we look at several solar cycles, some solar maximums peak at a much higher sunspot number.
Solar activity was lower in Cycle 24. In contrast, Cycle 21, 22, and 23 had many more and much larger solar flares, CMEs, and solar energetic particles.
In addition to Cycle 25 appearing to peak earlier than predicted, it was also predicted to have a maximum similar to that of Cycle 24. Cycle 25 has already far surpassed this. The current solar maximum will be much larger than 24.
Looking at the most current data (as of October 2024), we can see how much Cycle 25 has surpassed Cycle 24. This graphic shows the daily sunspot number in green and the monthly average in black. It also shows the original prediction (blue) and a newer prediction that appears more accurate (red).
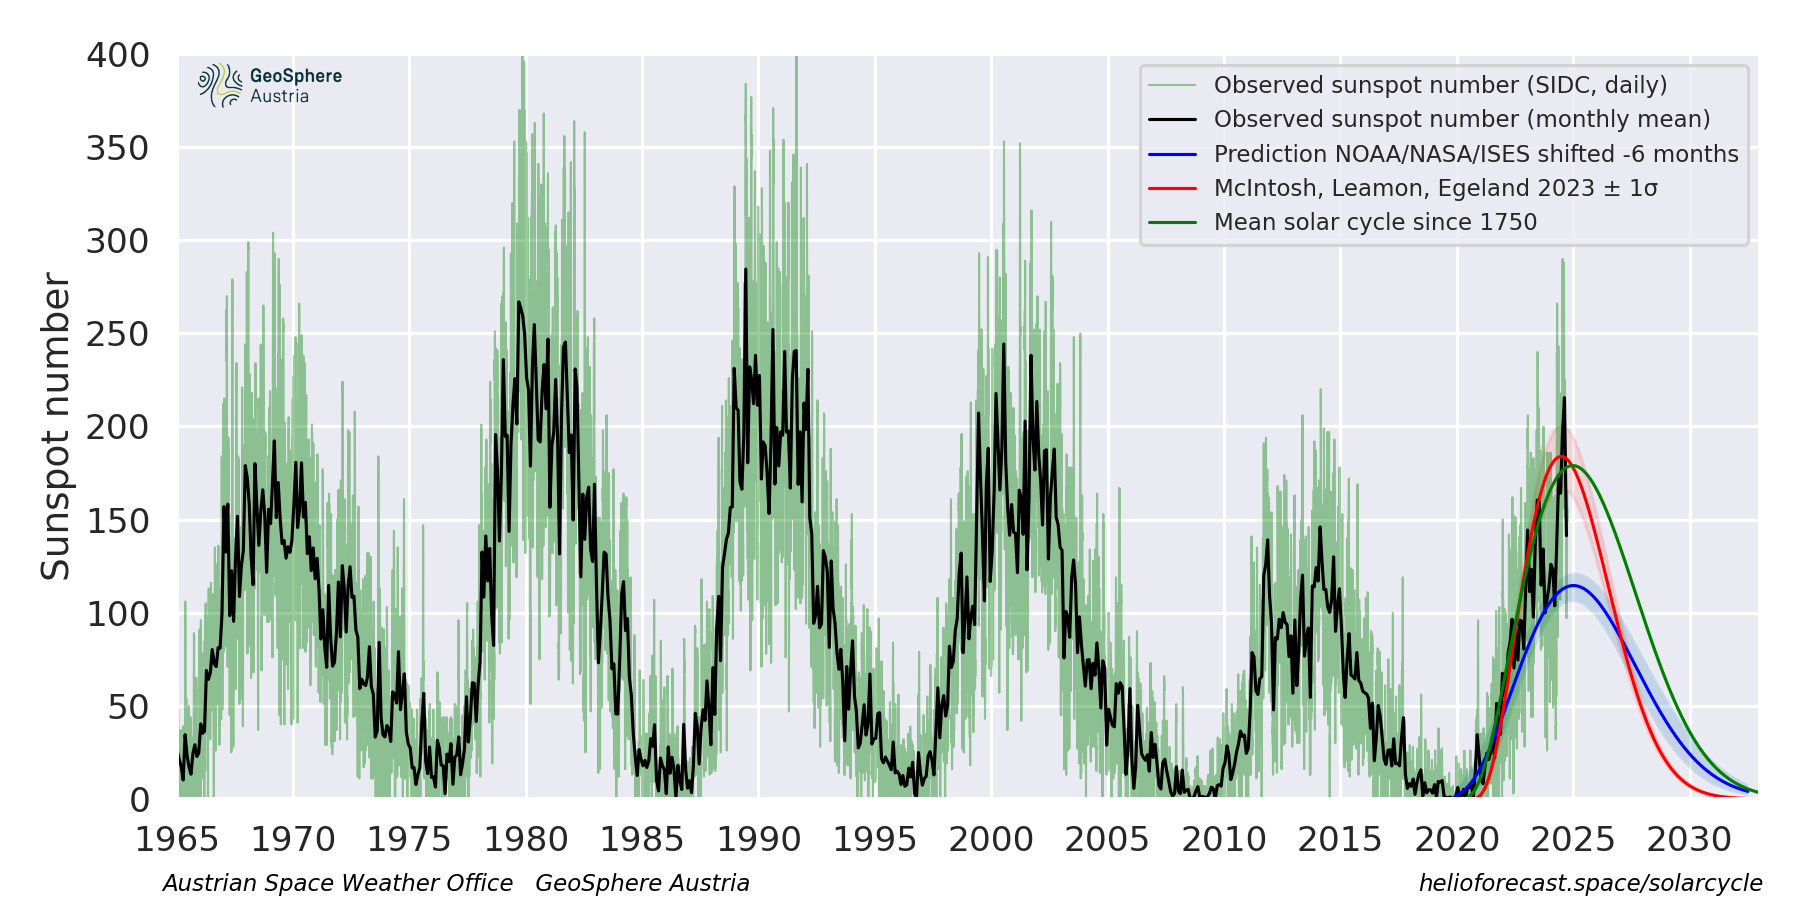
Image via helioforecast.space
The Sun’s Magnetic Field
The Sun has a positive and a negative magnetic pole similar to Earth. The solar magnetic poles flip or change polarity every 11 years, while the Earth’s poles reverse approximately every 300,000 years.
The reversal of the Sun’s polar field is an important feature that marks the conclusion of a solar cycle’s maximum phase and the start of its minimum phase.
The newly formed polar field will determine the intensity of the next solar cycle following the reversal.
The reversal occurs when a new, opposite-polarity magnetic field (such as one that shifts from positive to negative) weakens the Sun’s polar magnetic fields.
Sunspots are the cause of the reversal.
Solar material reorganizes the magnetic fields of sunspots as they emerge from the Sun’s center in pairs of polar opposites, weakening and expanding their opposing polarity.
The material carries these weaker sunspot fields toward the poles.
When opposing magnetic polarities come into contact, they cancel one another because the newly arrived field often has a different magnetic polarity from the one that already exists.
When enough opposite-polarity fields reach the poles during the height of the solar cycle, the process culminates in the destruction of the polar field and its replacement by a new polar field with the opposite magnetic polarity.
Although the timing of polar field reversals varies, they usually take a year or two to finish. It took almost five years for the north-polar field of Solar Cycle 24 to reverse!
Magnetism Facts
- All magnetic fields are produced by moving or spinning charged particles…somewhere
- Lines of magnetic force do not actually exist.
- Magnetic poles always come in pairs.
- The strongest magnetic field in nature is from the magnetar star SGR 1806-20, which has been estimated as 800 trillion Gauss.
- A typical galaxy like the Milky Way has a magnetic field strength of about 0.000003 Gauss.
- A refrigerator magnet has a strength of 100 Gauss.
- A sunspot can have a magnetic field with a strength up to 10,000 Gauss, but they live very short lives!
- Most magnetic storms on Earth happen during the Equinoxes in March and September
- The sun’s magnetic poles flip their location on the sun every 22 years, called the Hale Magnetic Cycle.
- Earth’s magnetic poles reverse their geographic locations every 300,000 years. The last event happened 780,000 years ago.
- Magnetic pole ‘reversals’ have no effect on the rotational poles of a star or planet.
- The geographic location of Earth’s North Magnetic Pole is currently moving nearly due-North at a speed of 100 meters per day.
- Earth’s magnetic field is declining in strength by 5% every century.
- Depending on your rate and direction of motion, a pure magnetic field can be turned into an electric field and vice versa.
- Magnetic fields and electric fields are aspects of a more basic field in nature called the electromagnetic field.
- A toy magnet produces more force on a paperclip than the entire mass of Earth through its gravity.
The Status of Solar Cycle 25
It is official! The Sun’s magnetic field has flipped and we are in the period of solar maximum.
The Sun’s polar field direction has reversed for Cycle 25: the south in mid-2023 and the north in late-2023. The smoothed average for both has the flip in August 2023. Local weather conditions at Mount Wilson Solar Observatory prevented continuous observations in the winter of 2023 and 2024.
- Beginning in December 2019, Solar Cycle 25—the 25th well-observed solar cycle—started with initially low solar activity.
- Solar activity has surged during the last five years, suggesting we are at Solar Cycle 25’s maximum phase.
- Given the great monthly fluctuation in data, it isn’t easy to pinpoint the precise solar cycle peak.
- The data must be smoothed across 13 months to precisely identify the cycle’s peak.
- The peak cannot be established until at least six months to a year of steady declining solar activity.
- Solar Cycle 24 shows that the biggest peak in monthly data could not be the actual solar cycle peak.
- While smaller cycles have prolonged maximum phases (3–4 years), larger solar cycles often include sharp, brief phases (1-2 years).
- Smaller cycles, such as Solar Cycle 25, might include double or triple peaks, challenging the confirmation of a maximum.
- Though still somewhat modest, Solar Cycle 25 is predicted to be bigger than Solar Cycle 24.
- Solar Cycle 25 is longer; its maximum phase should last three to four years.
- The NOAA/NASA solar cycle panel predicts around another year before the decreasing phase starts; we are roughly two years into the maximum period now.
- Though high-impact space weather events can still occur even after the solar maximum, the falling phase will return to the solar minimum, marked by fewer sunspots.
- Though sunspots are decreasing, major solar event frequently define the falling phase of the solar cycle.
C. Alex Young is interviewed about the current solar cycle and what a magnetic flip means for the earth and NASA’s study of magnetic fields. Credit: NASA/GSFC/PFSS
This visualization shows the position of the sun’s magnetic fields from January 1997 to December 2013. The field lines swarm with activity: The magenta lines show where the sun’s overall field is negative and the green lines show where it is positive. A region with more electrons is negative, the region with less is labeled positive. Additional gray lines represent areas of local magnetic variation.
The entire sun’s magnetic polarity, flips approximately every 11 years — though sometimes it takes quite a bit longer — and defines what’s known as the solar cycle. The visualization shows how in 1997, the sun shows the positive polarity on the top, and the negative polarity on the bottom. Over the next 12 years, each set of lines is seen to creep toward the opposite pole eventually showing a complete flip. By the end of the movie, each set of lines are working their way back to show a positive polarity on the top to complete the full 22 year magnetic solar cycle.
At the height of each magnetic flip, the sun goes through periods of more solar activity, during which there are more sunspots, and more eruptive events such as solar flares and coronal mass ejections, or CMEs. The point in time with the most sunspots is called solar maximum.
Credit: NASA/GSFC/PFSS
Understanding the Sun’s behavior is an important part of life in our solar system. The Sun’s powerful outbursts can disturb the satellites and communications signals traveling around Earth, or one day, Artemis astronauts exploring distant worlds. NASA scientists study the solar cycle so we can better predict solar activity. As of 2020, the Sun has begun to shake off the sleep of minimum, which occurred in December 2019, and Solar Cycle 25 is underway. Scientists use several indicators to track solar cycle progress.
Credit: NASA’s Goddard Space Flight Center • Music: “Infinite” by Joseph Pincus [ASCAP]; “Reflective Sensations”, “Ideas For Tomorrow”, “Think Tank” by Laurent Dury [SACEM]; “Wonderful Orbit” by Tom Furse Fairfax Cowan [PRS], via Universal Production Music
What is the result of all this increased activity at solar maximum?
Aurora
The most obvious thing we can see is enhanced auroras, i.e., the northern and southern lights. Usually, auroras are confined near the magnetic poles, which are similar locations but somewhat different from the geographic poles. This means that auroras are usually observed at locations like Alaska, Northern Canada, Scandinavia in the northern hemisphere, and Antarctica in the southern hemisphere.
Here’s what the aurora looked in like in real-time last night over our heads in Fairbanks, Alaska pic.twitter.com/XaXDhZ5JIS
— Vincent Ledvina (@Vincent_Ledvina) October 8, 2024
Learn more about aurora here »
Impact on Technology
Many other effects from solar activity are not as obvious but can have a significant and detrimental impact on our technological society. These solar storms can impair radio communications, jeopardize electrical power systems, harm delicate satellite electronics, deteriorate satellite orbits, and induce errors in navigational devices.
Radiation from these events can potentially injure astronauts not inside Earth’s magnetosphere or atmosphere. These solar storms impact planets, moons, comets, asteroids, and even the borders of the solar system itself, affecting the entire solar system.
Thankfully, our atmosphere and the invisible magnetic field known as the magnetosphere shield our planet from the damaging impacts of radiation and plasma. The numerous spacecraft, telescopes, and scientists who monitor the radiation flow in space, or space weather, and use that data to send out Space Weather Alerts that alert people on Earth to impending radiation, further protect us.
This graphic from the European Space Agency (ESA) provides an overview of all the important parts of our technological society that are affected and often negatively impacted by the environment created by solar storms (space weather).
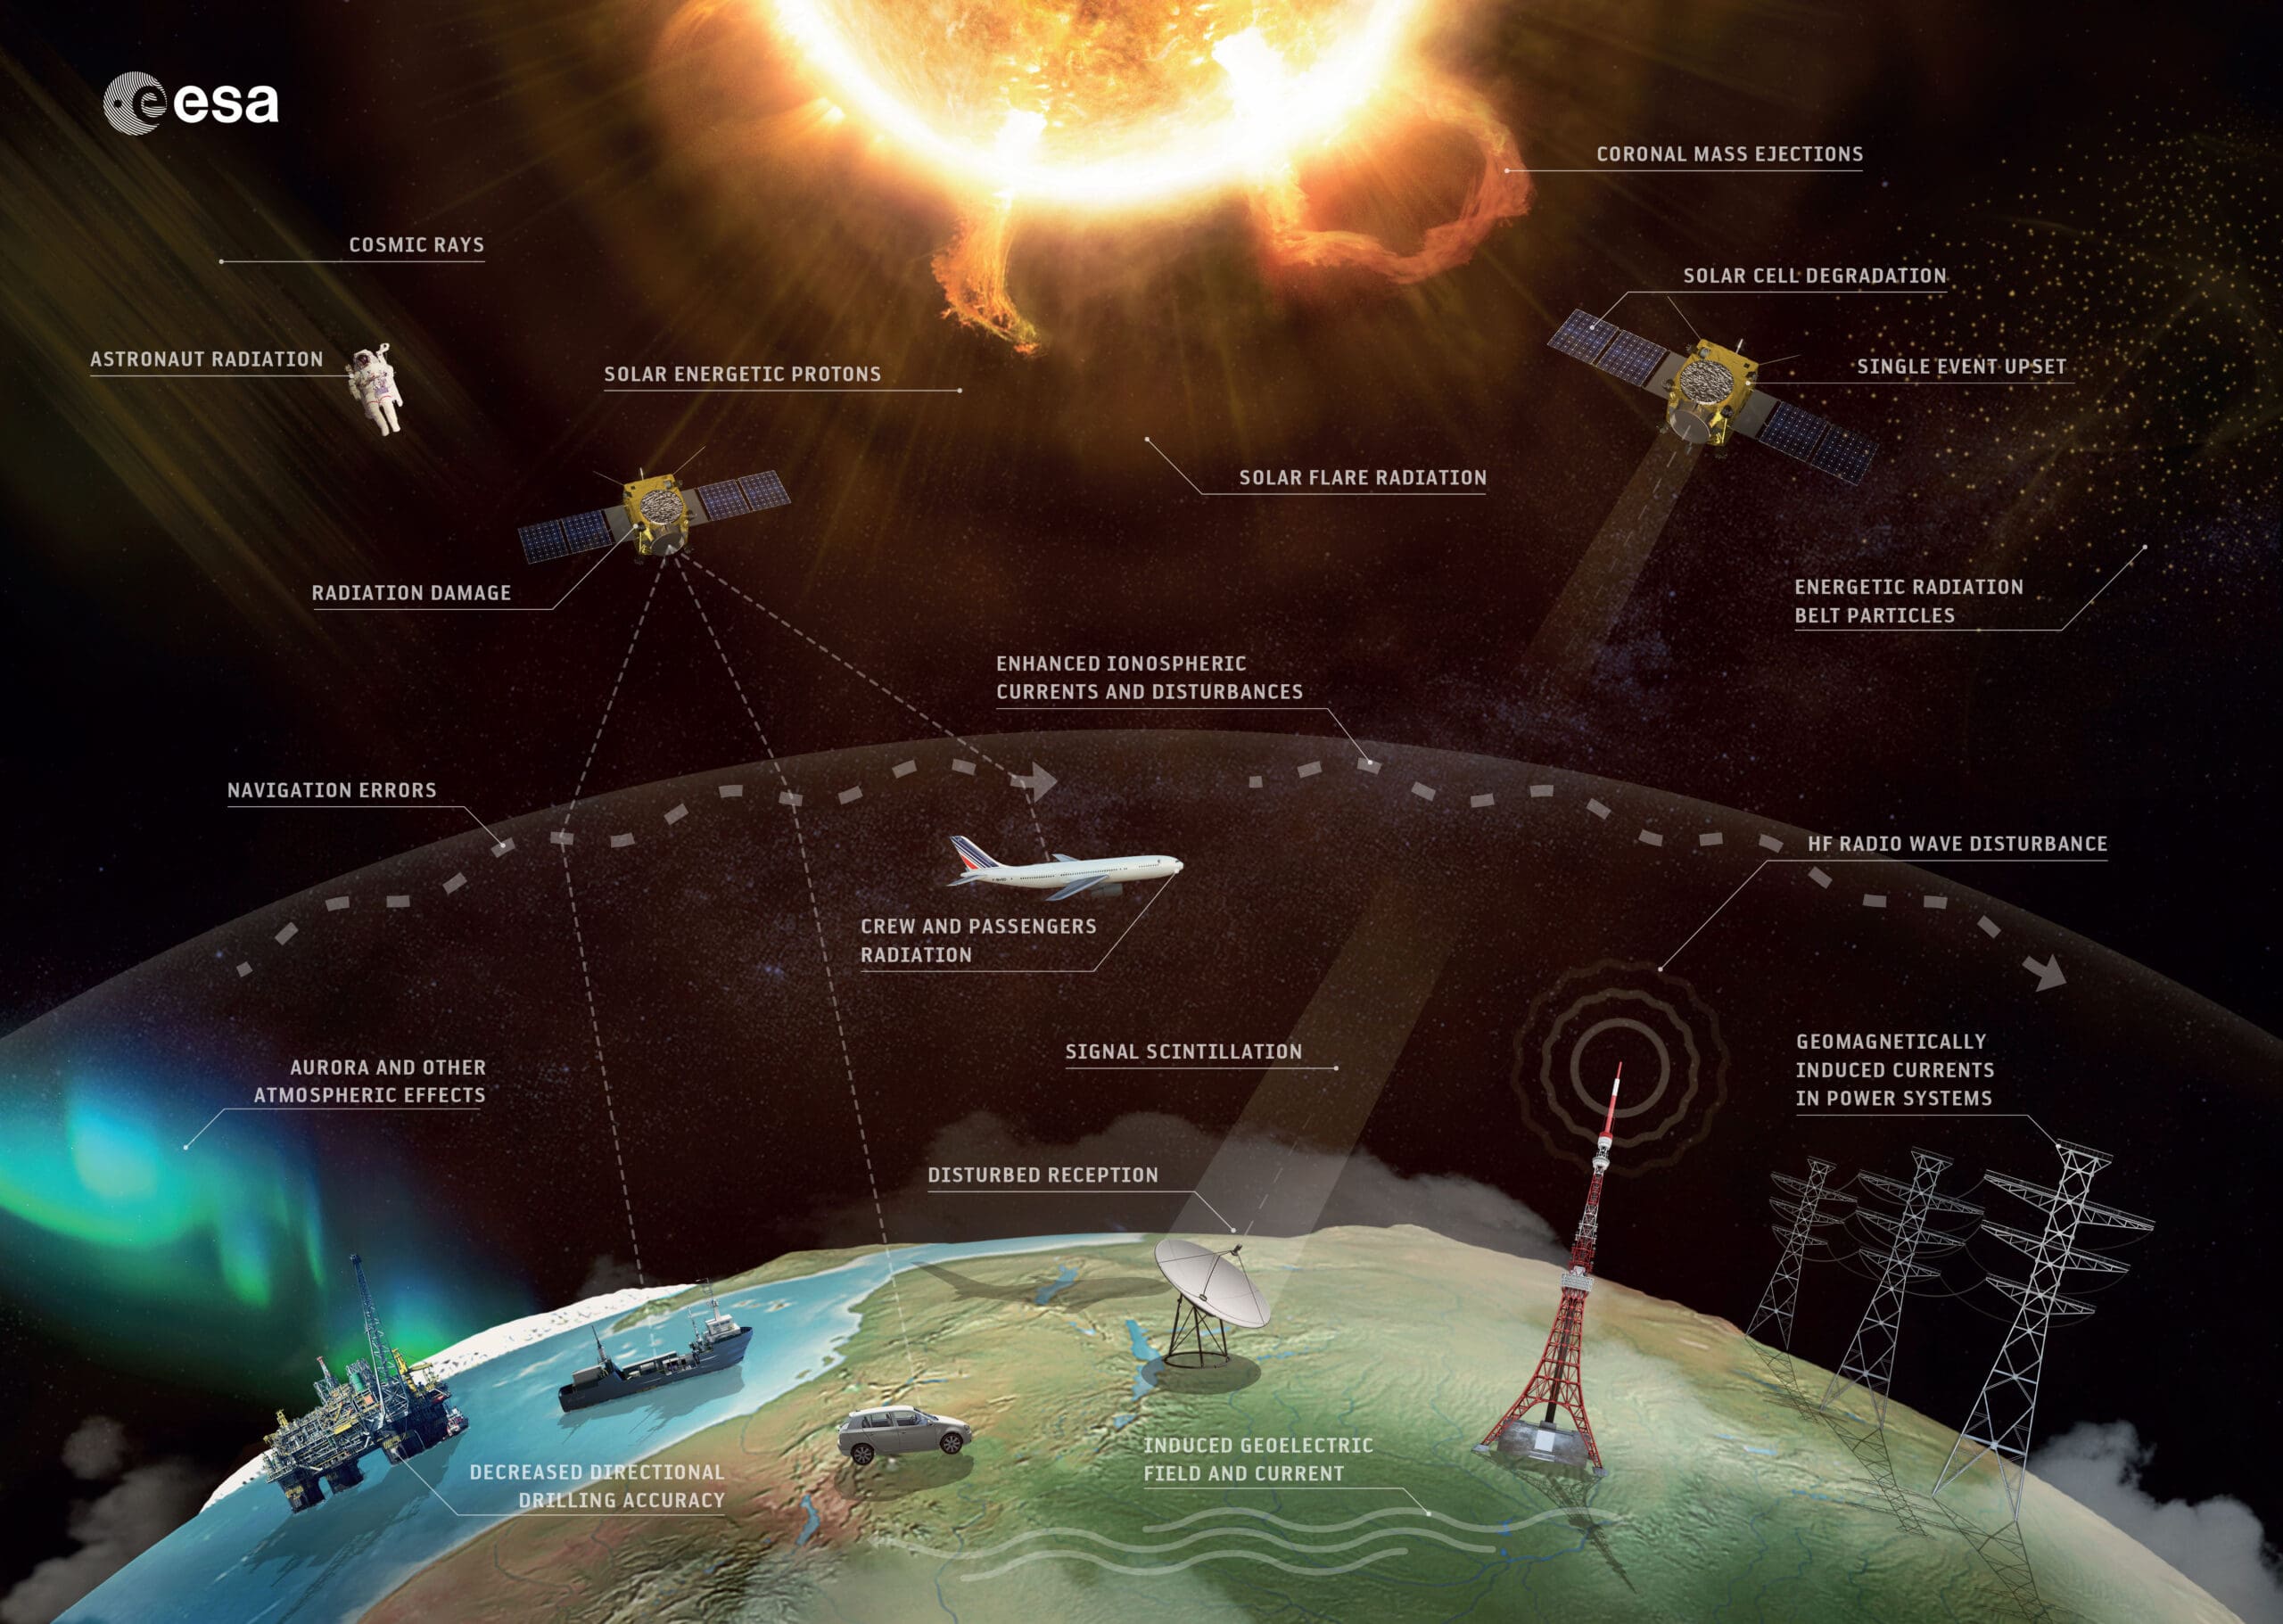
This graphic from the European Space Agency (ESA) provides an overview of all the important parts of our technological society that are affected and often negatively impacted by the environment created by solar storms (space weather). Image via ESA
To see what is happening daily with the Sun and space weather, visit EarthSky.org’s daily solar and space weather update.
For more on solar maximums and solar activity during this solar cycle, check out this CNN article: “The sun’s activity is peaking sooner than expected.”
NASA also has a recent article on solar maximum: “NASA, NOAA: Sun Reaches Maximum Phase in 11-Year Solar Cycle.”
