Eclipse in Chile & Argentina
Total Solar Eclipse – July 2, 2019
Watch the reply from 3 minutes before totality!
(START AT 39:50 if it does not automatically do so.)
START AT 39:50 for 3 minutes before totality! Video Credit: Exploratorium / NASA • Photo Credit: NASA/Aubrey Gemignani
Thank you Argentina. See you again in December 2020. #Eclipse2019 pic.twitter.com/RakuIfKzqk
— Ryan Milligan (@ryanomilligan) July 3, 2019
Time-lapse movie of totality taken from Valle Encantado, Mogna, Argentina. #Eclipse2019 #GoPro pic.twitter.com/xbAYNH1UQP
— Ryan Milligan (@ryanomilligan) July 4, 2019
The Eclipse in Chile and Argentina
On Tuesday, July 2, 2019, the Moon passed in front of the Sun, casting its shadow across South America and the southern Pacific Ocean.
The Moon’s shadow can be divided into areas called the umbra and the penumbra. Within the penumbra, the Sun is only partially blocked, and observers experience a partial eclipse. The much smaller umbra lies at the very center of the shadow cone, and anyone there sees the Moon entirely cover the Sun in a total solar eclipse.
In the animation, the umbra is the small black oval. The red streak behind this oval is the path of totality. Anyone within this path will see a total eclipse when the umbra passes over them. The much larger shaded bullseye pattern represents the penumbra. Steps in the shading denote different percentages of Sun coverage (obscuration), at levels of 90%, 75%, 50% and 25%. The images of the Sun show its appearance at a number of locations during the eclipse, each oriented to the local horizon.
The numbers in the lower left corner give the latitude and longitude of the center of the umbra as it moves eastward, along with the altitude of the Sun above the horizon at that point. Also shown is the duration of totality: for anyone standing at the center point, this is how long the total solar eclipse will last.
A view of the Moon’s shadow during the July 2, 2019 total solar eclipse showing the umbra (black oval), penumbra (concentric shaded ovals), and path of totality (red). Images of the Sun show its appearance in a number of locations, each oriented to the local horizon.
A map-like view of the Earth during the total solar eclipse of July 2, 2019, showing the umbra (black oval), penumbra (concentric shaded ovals), and the path of totality (red). This equirectangular projection is suitable for spherical displays and for spherical mapping in 3D animation software.
This map of Chile and Argentina shows the path of the Moon’s umbral shadow — the path of totality — during the total solar eclipse on July 2, 2019. Features include national boundaries, major roads, and place names. The umbra is shown at 3-minute intervals labeled in the local time zone of the umbra center (Chile or Argentina standard time). To read about the reason the shapes aren’t smooth ovals, go here. At 300 DPI, the scale of the map is approximately 1:4,000,000.
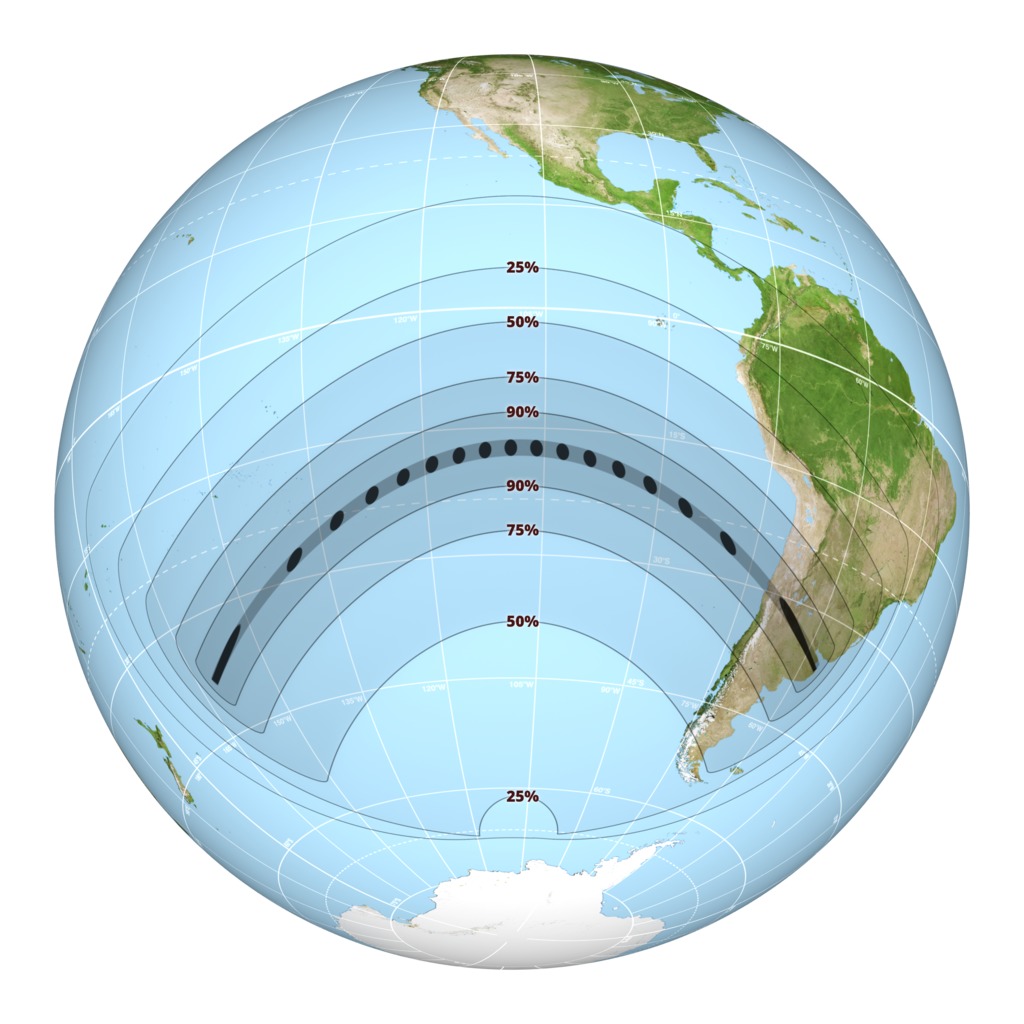
The map above shows the global extent of the shadow path. The umbra is drawn at 10-minute intervals.
You might think that calculating the circumstances of an eclipse would be, if not easy, then at least precise. If you do the math correctly, you’d expect to get exactly the same answers as everyone else. But the universe is more subtle than that. The Earth is neither smooth nor perfectly spherical, nor does it rotate at a perfectly constant, predictable speed. The Moon isn’t smooth, either, which means that the shadow it casts isn’t a simple circle. And our knowledge of the size of the Sun is uncertain by a factor of about 0.2%, enough to affect the duration of totality by several seconds.
Everyone who performs these calculations will make certain choices to simplify the math or to precisely define an imperfectly known number. The choices often depend on the goals and the computing resources of the calculator, and as you’d expect, the results will differ slightly. You can get quite good results with a relatively simple approach, but it sometimes takes an enormous effort to get only slightly better answers.
The following table lists some of the constants and data used for this animation.
| Earth radius | 6378.137 km |
|---|---|
| Earth flattening | 1 / 298.257 (the WGS 84 ellipsoid) |
| Moon radius | 1737.4 km (k = 0.2723993) |
| Sun radius | 696,000 km (959.634 arcsec at 1 AU) |
| Ephemeris | DE 421 |
| Earth orientation | SOFA library iauC2t06a() |
| Delta UTC | 69.184 seconds (TT – TAI + 37 leap seconds) |
| ΔT | 69.368 seconds |
A number of sources explain Bessel’s method of solar eclipse calculation, including chapter 9 of Astronomy on the Personal Computer by Oliver Montenbruck and Thomas Pflager and the eclipses chapter of The Explanatory Supplement to the Astronomical Almanac. The method was adapted to the routines available in NAIF’s SPICE software library.
See this SVS page for a larger scale map of the eclipse path over South America that takes into account the lunar limb, Earth elevations, and other details that have been ignored here.
Content & Visualization Credits: NASA’s Scientific Visualization Studio • Ernie Wright (USRA): Lead Visualizer • Laurence Schuler (ADNET): Technical Support • Ian Jones (ADNET): Technical Support • Genna Duberstein (USRA): Producer • Ernie Wright (USRA): Programmer
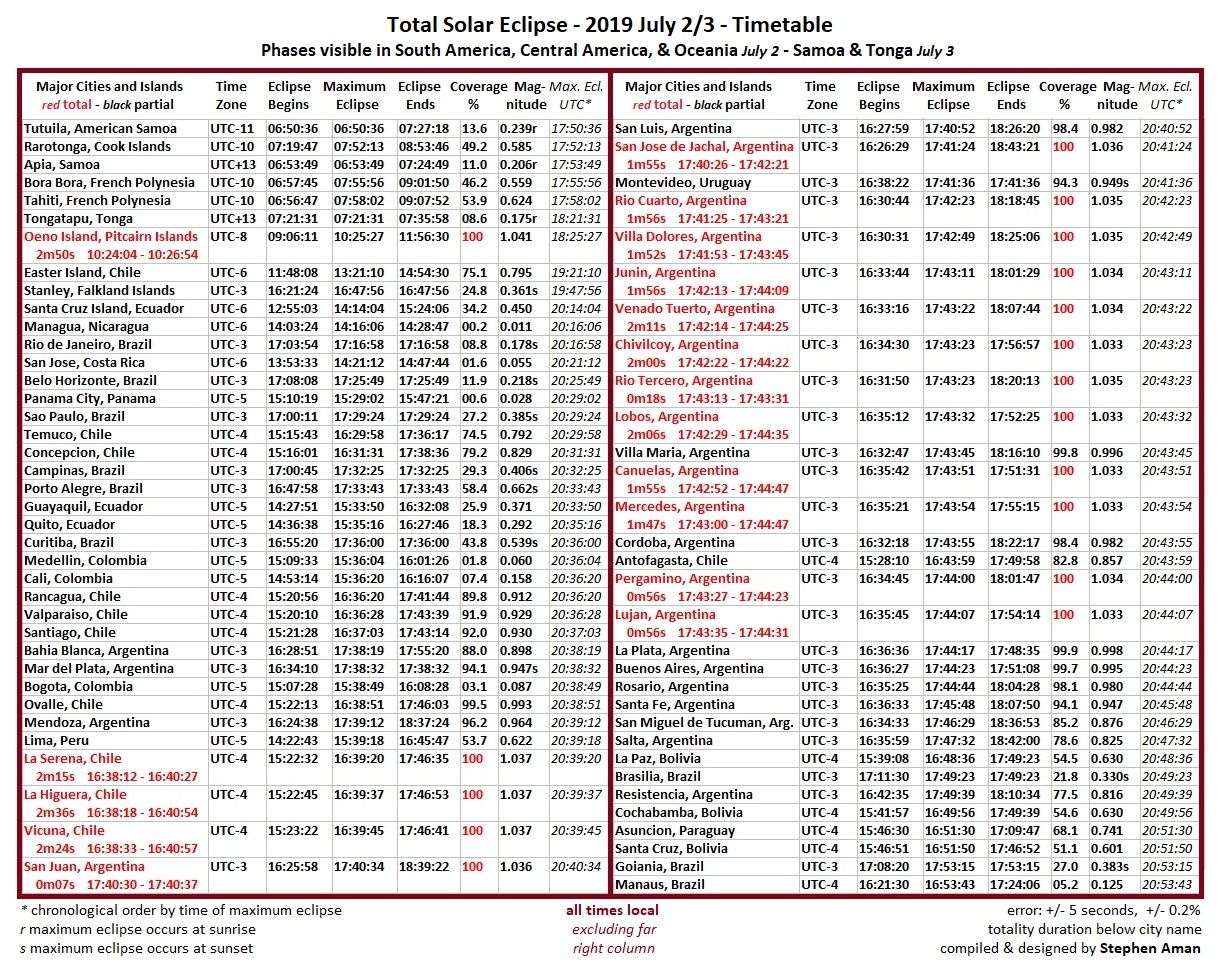
Stephen Aman in Orlando, Florida, kindly provided this chart of eclipse times for all major cities and islands that lie in its path. Shared by EarthSky.org. Thank you, Stephen!
The Moon moves right to left in its orbit around the Earth.
Here you can see an animation of the Moon’s shadow it casts hits the Earth during the August 21, 2017 total solar eclipse.
A solar eclipse occurs when the Moon passes between the Sun and the Earth, casting its shadow on the Earth. The shadow comprises two concentric cones called the umbra and the penumbra. Observers on the Earth who are within the smaller, central umbra see the Sun completely blocked. Within the larger penumbra, the Sun is only partially blocked.
In this animation, the Earth, Moon, Sun, and shadow cones are viewed through a telescopic lens on a virtual camera located far behind the Earth. Long focal lengths like the one used here appear to compress the distance between near and far objects. Despite appearances, the geometry of the scene is correct. The Moon’s umbra cone is roughly 30 Earth diameters long, barely enough to reach the Earth, while the Sun is almost 400 times farther away.
From this perspective, we see the night sides of both the Earth and the Moon. Solar eclipses can only occur during New Moon, when the entire Earth-facing side of the Moon is experiencing nighttime darkness.
CREDIT: NASA’s Scientific Visualization Studio • Ernie Wright (USRA): Lead Visualizer • Kayvon Sharghi (USRA): Producer
Learn More About the Eclipse in Chile and Argentina
- Live from Chile – Exploratorium
- Total Solar Eclipse 2019: A Complete Guide – Space.com
- South American solar eclipse on July 2 – EarthSky.org
- Our Complete Guide to the July 2019 Total Solar Eclipse – Universe Today
- Stories from the Path of Totality – Exploratorium
- Total Solar Eclipse – July 2, 2019 – Eclipsophile
ECLIPSES HELP US STUDY THE SUN
Studying the Sun during total solar eclipses helps scientists understand the source and behavior of solar radiation that drives space weather near Earth, which can affect the health of astronauts in space and the durability of materials used to build spacecraft.
Similar data will be important in planning NASA’s return of astronauts to the Moon in 2024 and eventual crewed missions to Mars.
Eclipses also set the stage for historic science.
NASA took advantage of the Aug. 21, 2017 eclipse by funding 11 ground-based scientific studies. As our scientists prepare their experiments for next week, we’re looking back to an historic 1860 total solar eclipse, which many think gave humanity our first glimpse of solar storms — called coronal mass ejections — 100 years before scientists first understood what they were.
Scientists observed these eruptions in the 1970s during the beginning of the modern satellite era, when satellites in space were able to capture thousands of images of solar activity that had never been seen before. But in hindsight, scientists realized their satellite images might not be the first record of these solar storms. Hand-drawn records of an 1860 total solar eclipse bore surprising resemblance to these groundbreaking satellite images.
CREDITS: NASA’s Goddard Space Flight Center • Music credits: ‘Electricity Wave’ by Jean-François Berger [SACEM] and ‘Solar Winds’ by Ben Niblett [PRS], Jon Cotton [PRS]
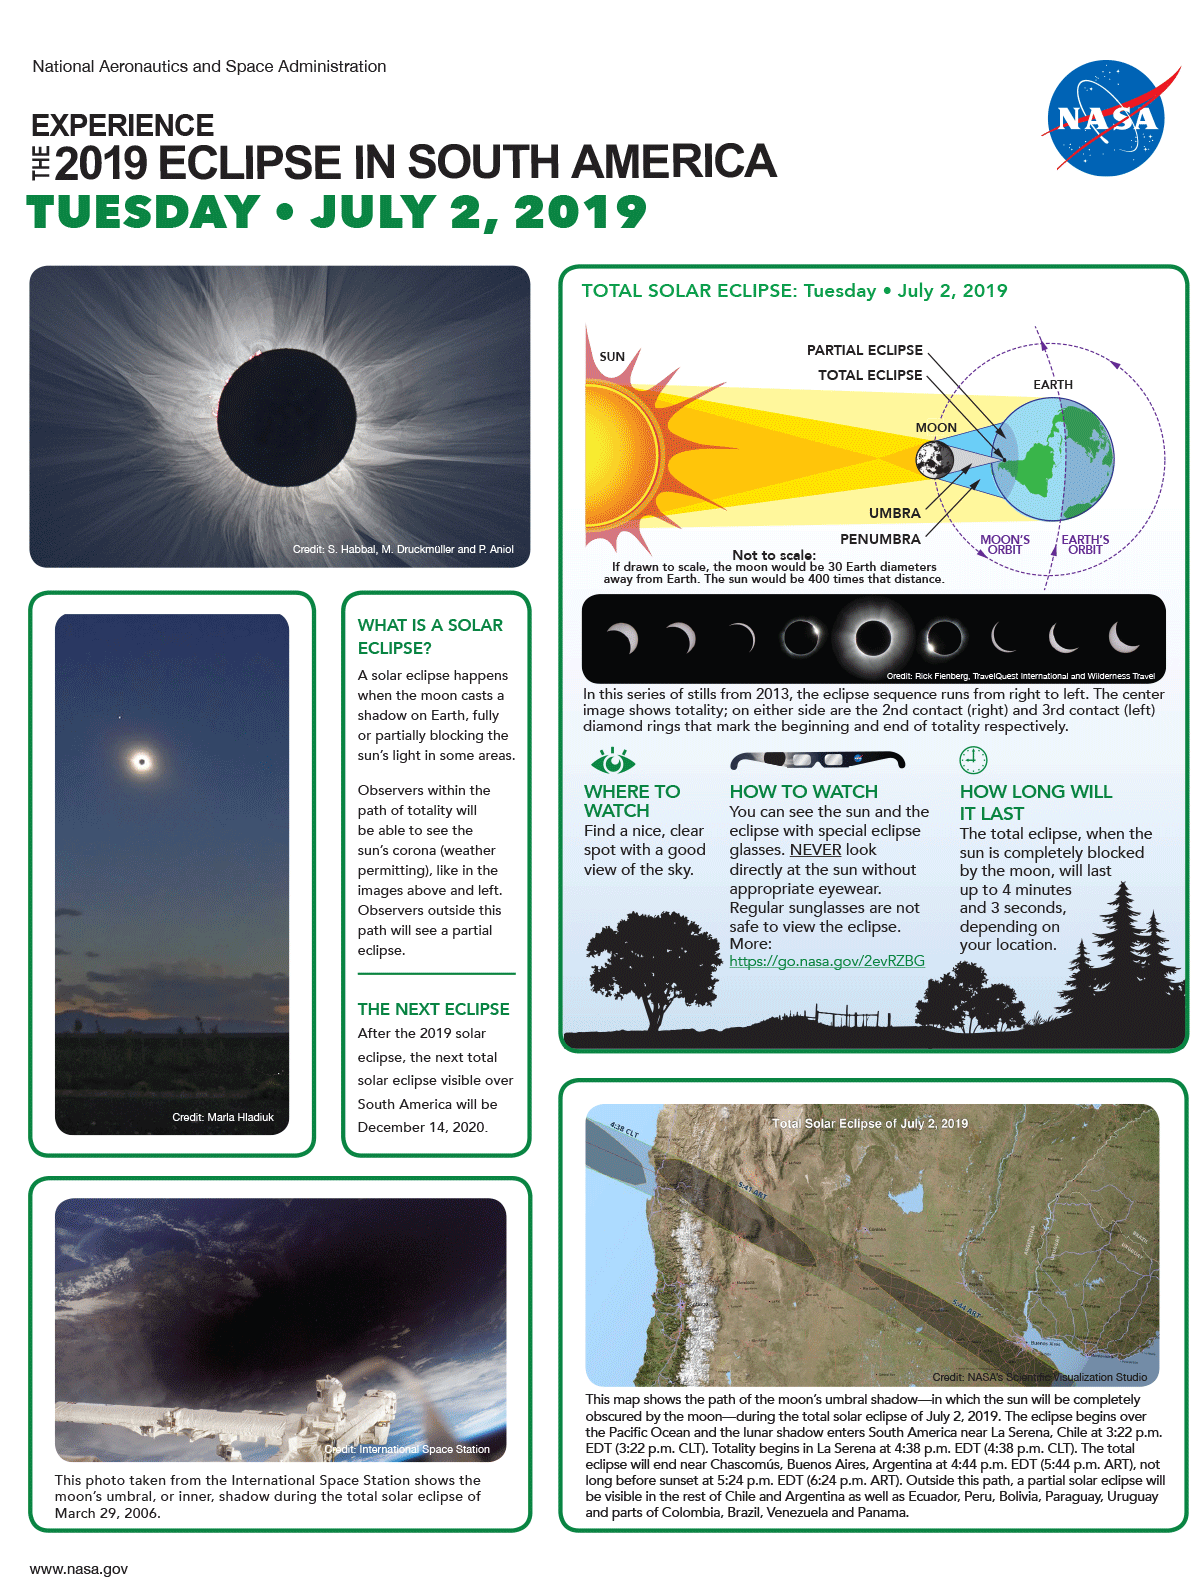
CREDIT: NASA
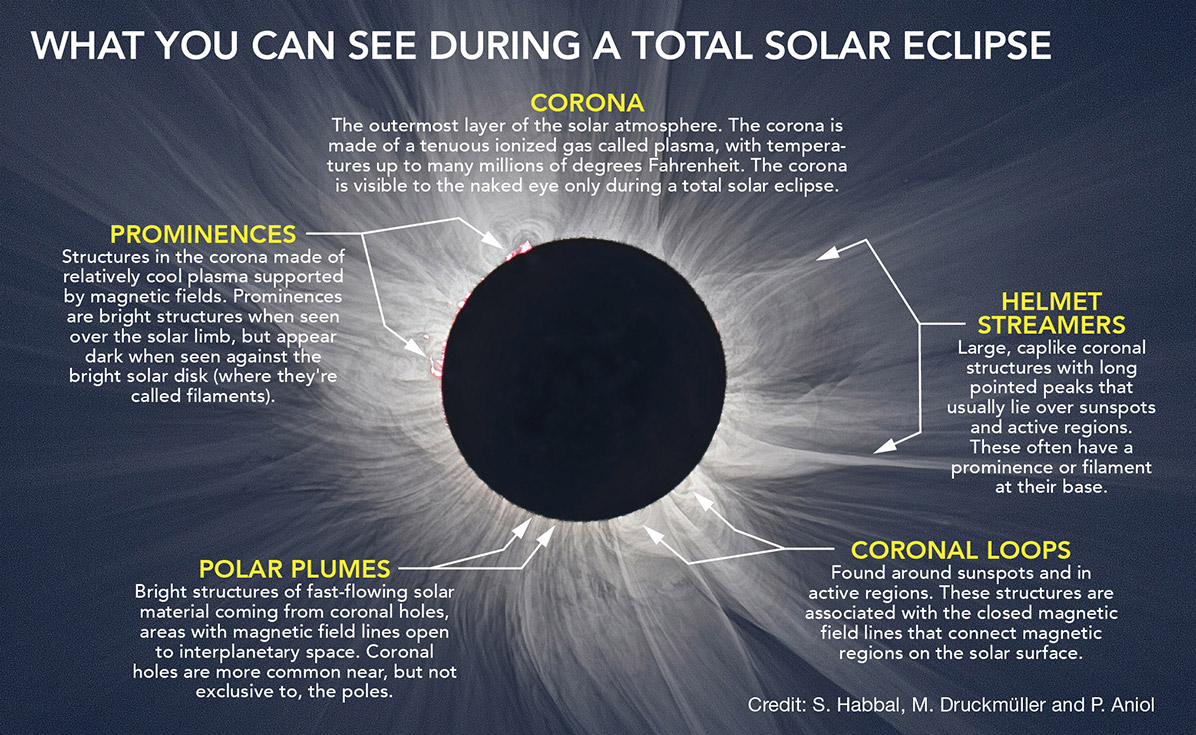
Make plans to see a total solar eclipse live!
This eclipse is only visible in Chile & Argentina, so you’re not going to see it in person unless you’re already there. Luckily, C. Alex Young is, and hopefully, he will see it since he had clouds for the 2017 eclipse. Second chances don’t come around often for eclipses! If you are in or near the US, start making plans now to see the next one on April 4, 2024! After that, you’ll have to travel, because you won’t see another one in the US until 2045!!
There is a HUGE difference between 99% and 100% totality, so “close” means you’ll miss the real show. Watch online to get a sense of what you’ll see. Actually experiencing it live is an amazing bucket list experience. Here’s what you’ll need to be prepared…
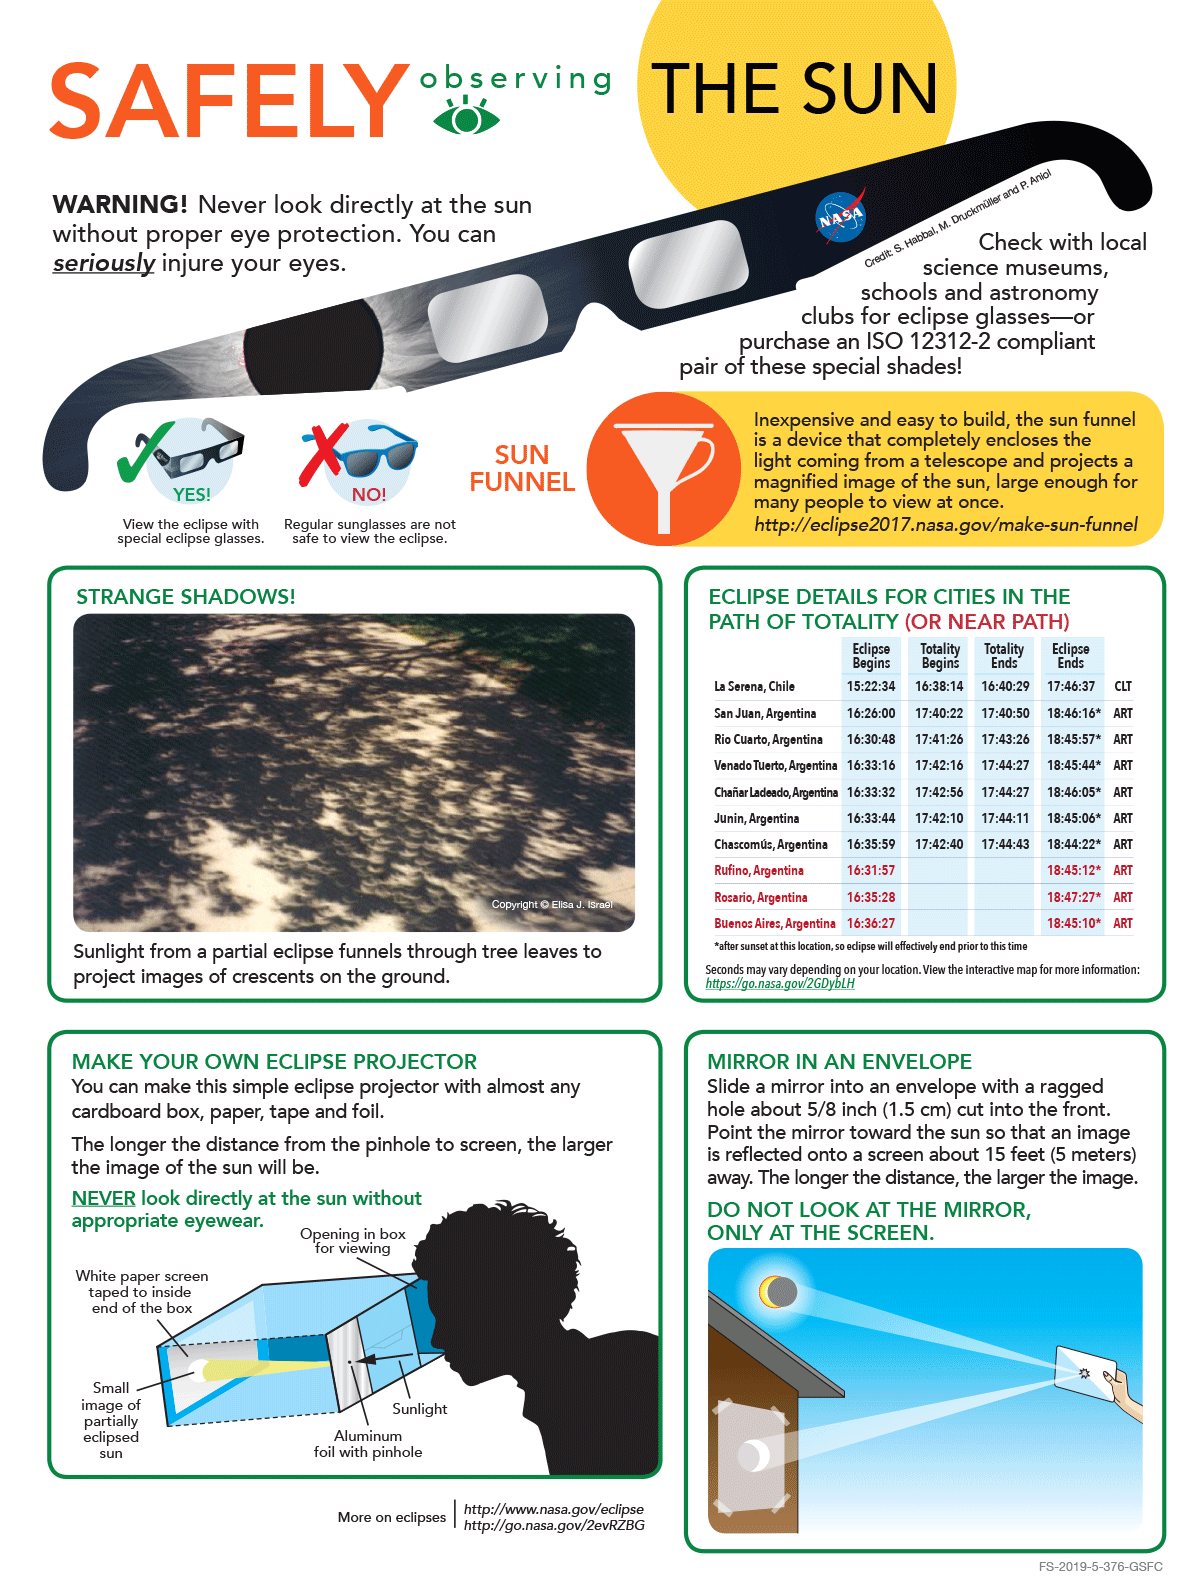
CREDIT: NASA
MORE ECLIPSES ARE COMING!
The next two Solar Eclipses are Annular, meaning the sun remains visible as a bright ring around the moon. These happen on December 26, 2019 and June 21, 2020.
The next Total Solar Eclipse is on December 14, 2020, also visible in Chile and Argentina, but farther south. And don’t miss the next one in the US, on April 8, 2024!! It’s the last one visible in the USA until August 12, 2045!

