Get the latest updates about solar activity!
Space Weather
Space weather includes any and all conditions and events on the sun, in the solar wind, in near-Earth space and in our upper atmosphere that can affect space-borne and ground-based technological systems and through these, human life and endeavor.
Space weather includes any and all conditions and events on the sun, in the solar wind, in near-Earth space and in our upper atmosphere that can affect space-borne and ground-based technological systems and through these, human life and endeavor.
The term “space weather” was coined not long ago to describe the dynamic conditions in the Earth’s outer space environment, in the same way that “weather” and “climate” refer to conditions in Earth’s lower atmosphere. On Earth and in our local space around the Earth this space weather can produce beautiful (northern lights) and destructive results (power and communication blackouts).
Here we will a brief overview of the type of phenomena that make up space weather, the effects we can experience on and near the Earth and some of the industries directly affected by it. Heliophysics is the science of space weather.
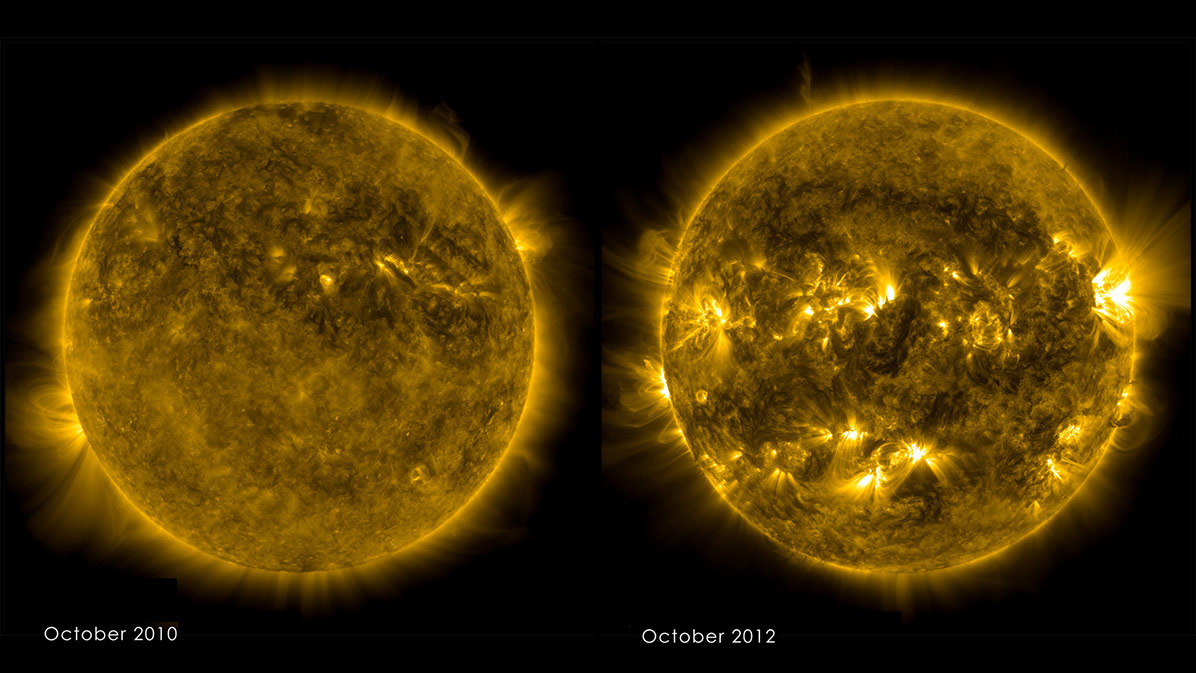
The sun goes through a natural cycle approximately every 11 years, hitting peaks and valleys of solar activity.
The cycle is marked by the increase and decrease of sunspots—visible as dark blemishes on the sun’s surface and connected to eruptions such as solar flares and coronal mass ejections. The largest number of sunspots in any given solar cycle is designated as “solar maximum,” and this next peak of activity is predicted to occur in 2013.
The eruptions that occur during solar maximum can’t harm humans on Earth. But scientists observe this activity, what they call space weather, because it can affect satellites in orbit and disrupt power grids on the ground. Watch the movie to see the kind of gigantic, and often beautiful, eruptions we expect to see more of in 2013.
CREDIT: NASA’s Goddard Space Flight Center
Space Weather Facts
- Solar flares can sometimes heat the solar surface to temperatures of 80 million F – far hotter that the sun’s core!
- The fastest Earth-directed coronal mass ejection was recorded on August 4, 1972 and traveled from the sun to earth in 14.6 hours – a speed of nearly 10 million kilometers per hour!
- On April 8, 1947, the largest sunspot in modern history reached its maximum size of over 330 times Earth’s area.
- The most powerful solar flare in the last 500 years occurred on September 2, 1859 and was sighted by two astronomers who happened to be looking at the sun at exactly the right time!
- Between May 10-12, 1999, the solar wind nearly vanished, causing Earth’s magnetosphere to expand in volume by over 100 times!
- A typical CME can be millions of kilometers in size, but have the mass of only a small mountain!
- Some sunspots are cool enough that water vapor can form at a temperature of 1,550 C.
- The most powerful aurora can generate over 1 trillion watts of power.
- The March 13, 1989 Quebec blackout, the result of a major geomagnetic storm, caused a $6 billion loss to the Canadian economy.
- During intense solar flares, astronauts see bright flashing streaks of light as a result of high-energy particles zipping through their eyeballs.
- The largest, single, challenge for astronauts traveling to Mars will be to overcome exposure to solar storms and radiation.
- Space Weather Forecasting costs only $5 million a year, but supports over $500 billion in annual revenue from the satellite and electrical power industries.
- Over $2 billion in satellite technology was damaged or destroyed during the last sunspot cycle.
- A major solar ‘superstorm’ such as the one in 1859 could cost $30 billion a day to the US electrical power grid, and up to $70 billion to the satellite industry.
- The August 4, 1972, solar particle storm was so powerful that, by some estimates, a space-suited astronaut would have received a lethal does of radiation.
- During a single second, the sun converts 4 million tons of matter into pure energy.
- The core of the sun is nearly as dense as lead, and has a temperature of 15 million C.
- During a severe solar storm, Earth loses about 100 tons of its atmosphere into space.
- Toy ‘rare-earth’ magnets can be 5 times stronger than a sunspot magnetic field.
Historical Solar Storms
The Halloween Storms
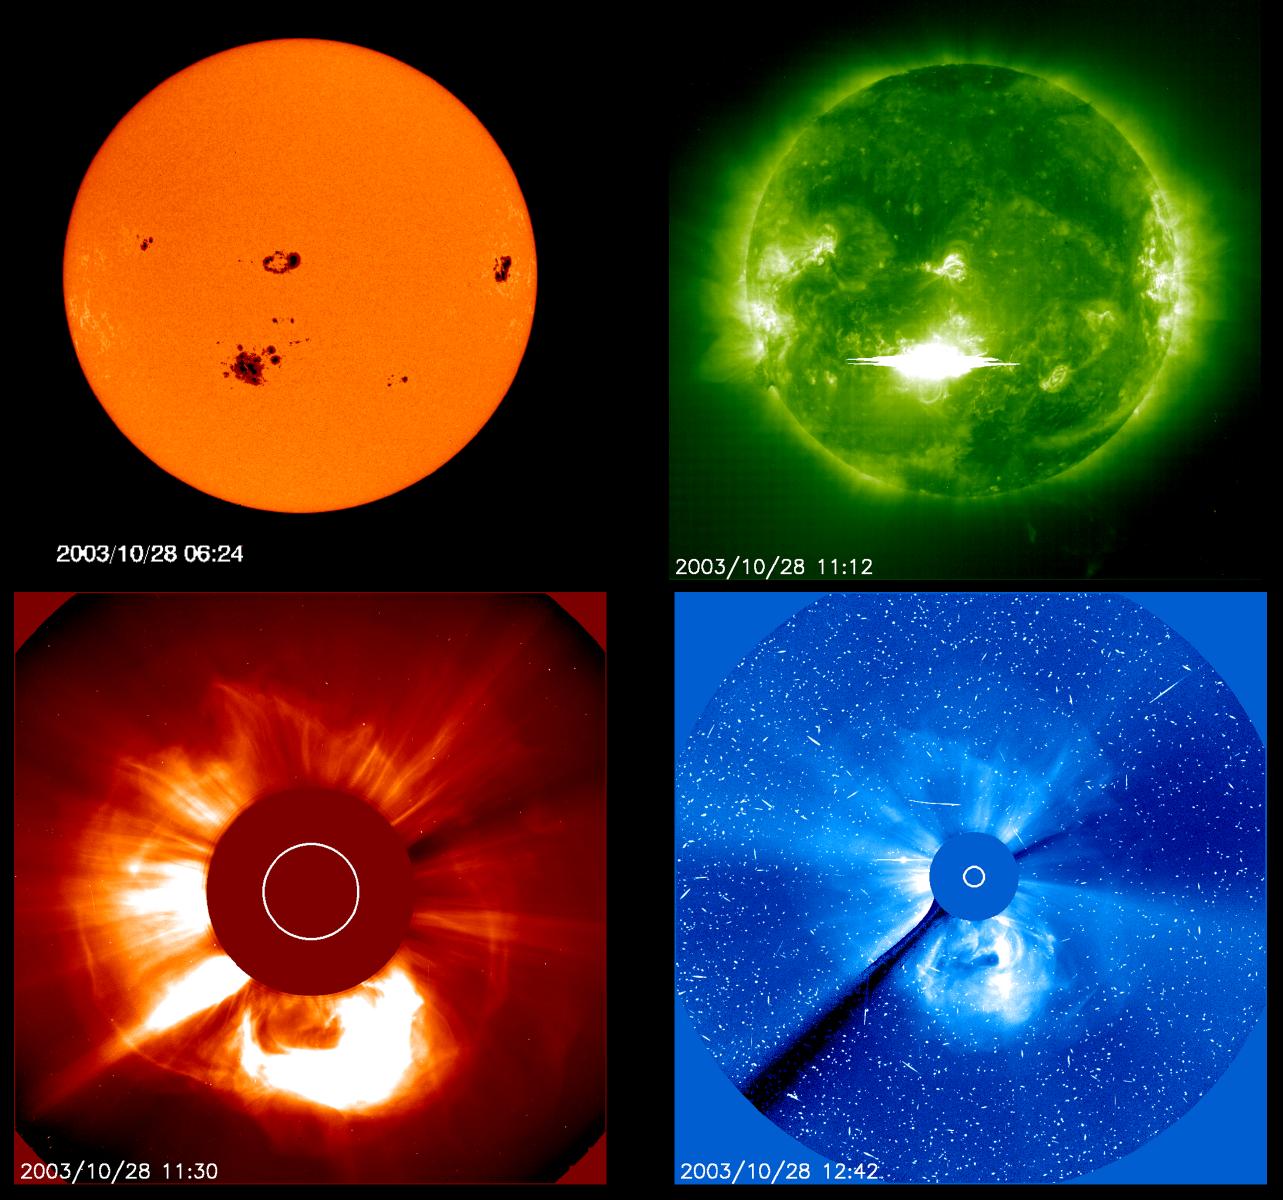
The figure below shows an example of a very large solar eruptive event from the famous 2 week series of space weather storms from October-November 2003. These events are referred to as the Halloween Storms.
July 23, 2012
Explore how NASA observatories worked together to help scientists track the journey of a massive solar eruption in this video.
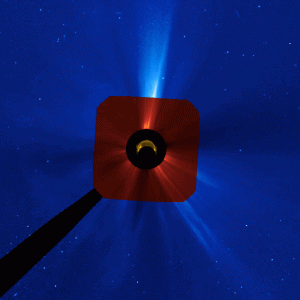
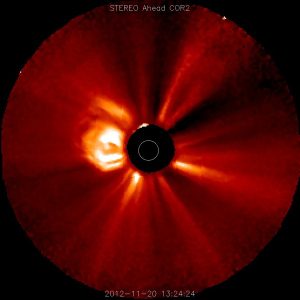
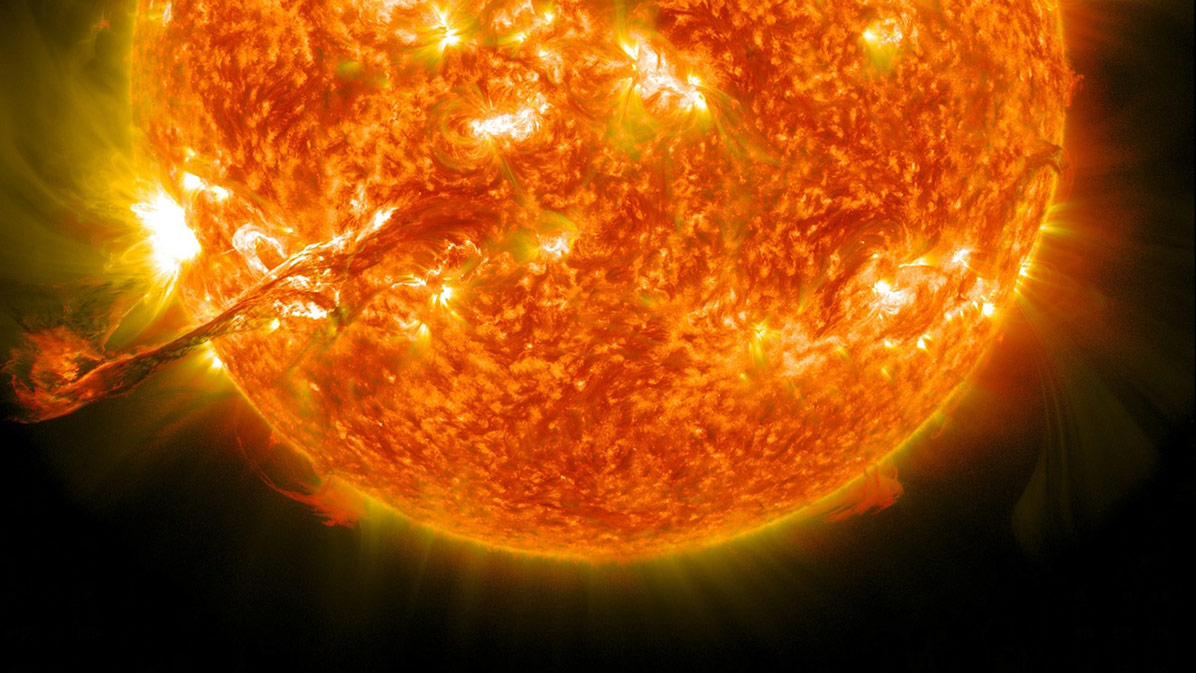
On July 23, 2012, a massive cloud of solar material erupted off the sun’s right side, zooming out into space and passing one of NASA’s twin STEREO spacecraft along the way.
Scientists clocked this giant cloud, known as a coronal mass ejection, or CME, as traveling over 1,800 miles per second as it left the sun. This was the fastest CME ever observed by STEREO. Luckily, it was moving in a direction safely away from Earth. The harshest space weather can have strong effects on the magnetic system surrounding our planet, which in turn can affect satellites and interrupt GPS and radio communications.
At its worst, rapidly changing magnetic field lines around Earth can induce electric surges in the power utility grids on the ground. Using observations from multiple NASA spacecraft, scientists reconstructed the full shape and expansion of the CME in a computer model. They learned that an earlier, smaller CME helped clear the path for the larger event, thus contributing to its unusual speed.
August 2012
July 20, 2013
Sources of Space Weather
Solar Flares
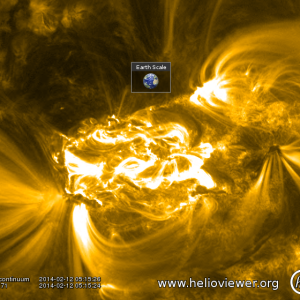
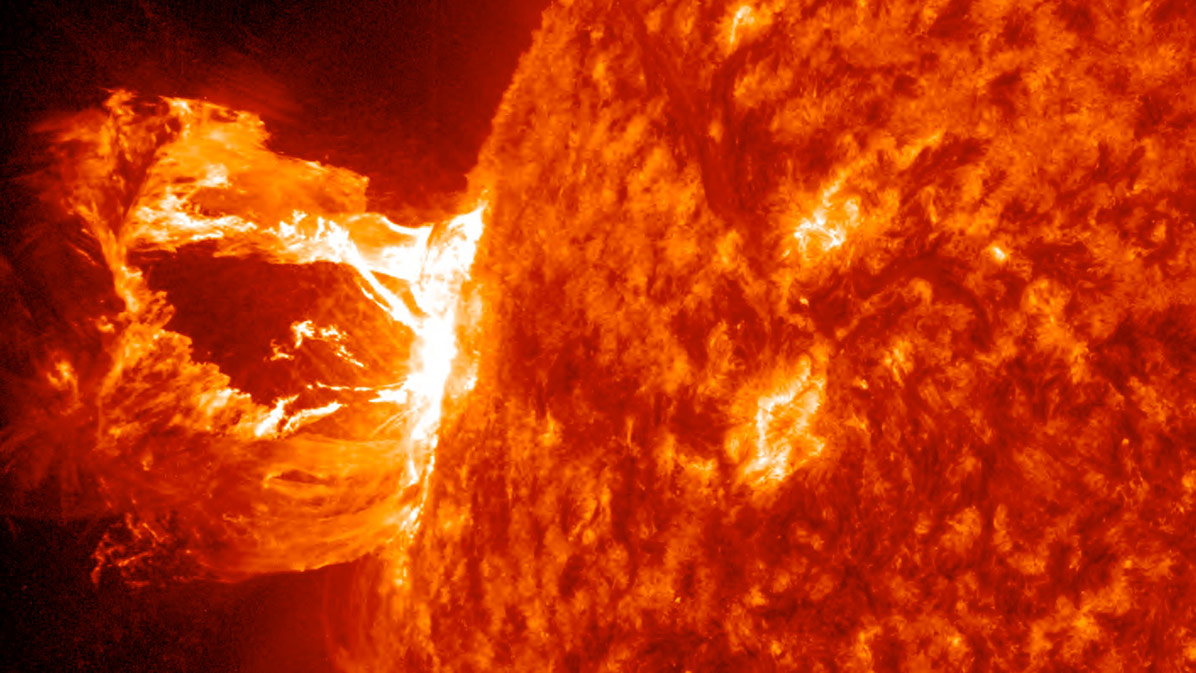
A solar flare is a bright flash of X-rays seen during an energetic explosion in an active region of the sun. It’s usually seen as a large burst of X-rays, but may also have a coincident bright flash of white light. A flare lasts a matter of minutes but releases an immense amount of energy. During solar flares the sun can be 1,000 times brighter in X-rays than usual.
Coronal Mass Ejections
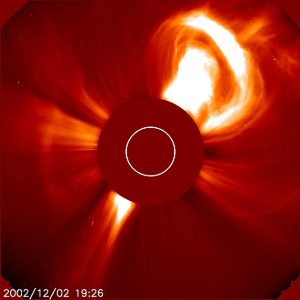
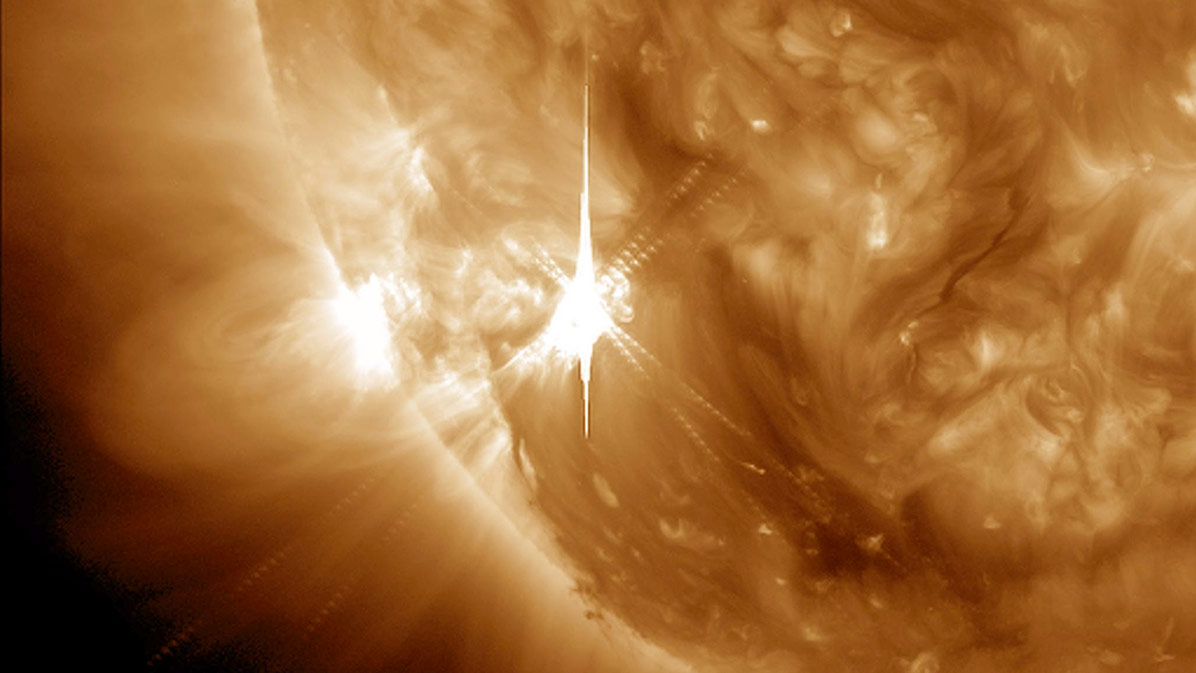
A Coronal Mass Ejection (CME) occurs when a prominence suspended above the surface of the sun erupts and sends millions of tons of material into space. This cloud of charged particles is generally confined within a magnetic field (like a magnetic bubble), expanding and traveling out through the solar system at speeds from about 200 km/s up to a staggering 2,000 km/s. When directed toward Earth, a CME typically arrives 2-3 days after eruption but in exceptional cases can arrive in less than 24 hours.
Geomagnetic Storms
Earth’s magnetosphere is a bubble created around us by our magnetic field, which protects us from most of the particles the sun throws at us. When a CME or high-speed stream arrives at Earth, it buffets the magnetosphere. High pressure discontinuities or and interplanetary shock waves can penetrate deeply and strongly affect the deep interior of Earth’s magnetosphere. There are also other modes of interaction. For example, if the arriving solar magnetic field is directed southward, it interacts strongly with Earth’s oppositely oriented magnetic field. As a result, Earth’s magnetic field is peeled open like an onion, allowing energetic solar wind particles to stream down the field lines to hit the atmosphere over the poles. At Earth’s surface, a magnetic storm is seen as a rapid drop in Earth’s magnetic field strength (typically a drop of 30 to 500 nT in 1-2 hours). This decrease lasts about 6 to 12 hours, after which the magnetic field gradually recovers over a period of several days.
Corotating Interaction Regions (CIR)
The solar wind can be highly structured because of structure within the sun’s upper atmosphere that generates and releases the solar wind. Such structures can be in the form of continuous and interacting streams that sweep periodically across Earth’s orbit. The variations in the solar wind parameters within these streams can cause geomagnetic disturbances within Earth’s space environment.
CREDIT: NASA, Radiation Belt Storm Probes Launch Press Kit
These visualizations presents a slice of the data through the ecliptic plane, the plane in which the planets of our solar system orbit. Because Pluto is a bit above this plane, the orbit is projected into the ecliptic plane of the data.
Everyone likes to check the weather in a far away destination before they travel there. This is especially true for spaceflight, where the destination may be where no one has gone before.
The mission of New Horizons to Pluto provided an opportunity to test our current space weather models, pushing them to the limit. This visualization presents the results from an Enlil model run, just one of the many space weather models being tested through the Community-Coordinated Modeling Center (CCMC) at NASA’s Goddard Space Flight Center as part of the “New Horizons Flyby Modeling Challenge”.
Three different variables are presented from the model – temperature, density, and pressure gradient, simultaneously, using the red, green and blue color channels of the color image. The density of the solar wind (green) flowing outward from the sun decreases as it spreads out. The temperature stays roughly constant as the solar wind material spreads through the solar system. We see the Parker spiral imprinted on the outflow from the spinning sun, much like the outflow from a spinning water sprinkler. We also see the strong density gradients (blue) created by coronal mass ejections and other shocks, propagating outward from the sun in the solar wind.
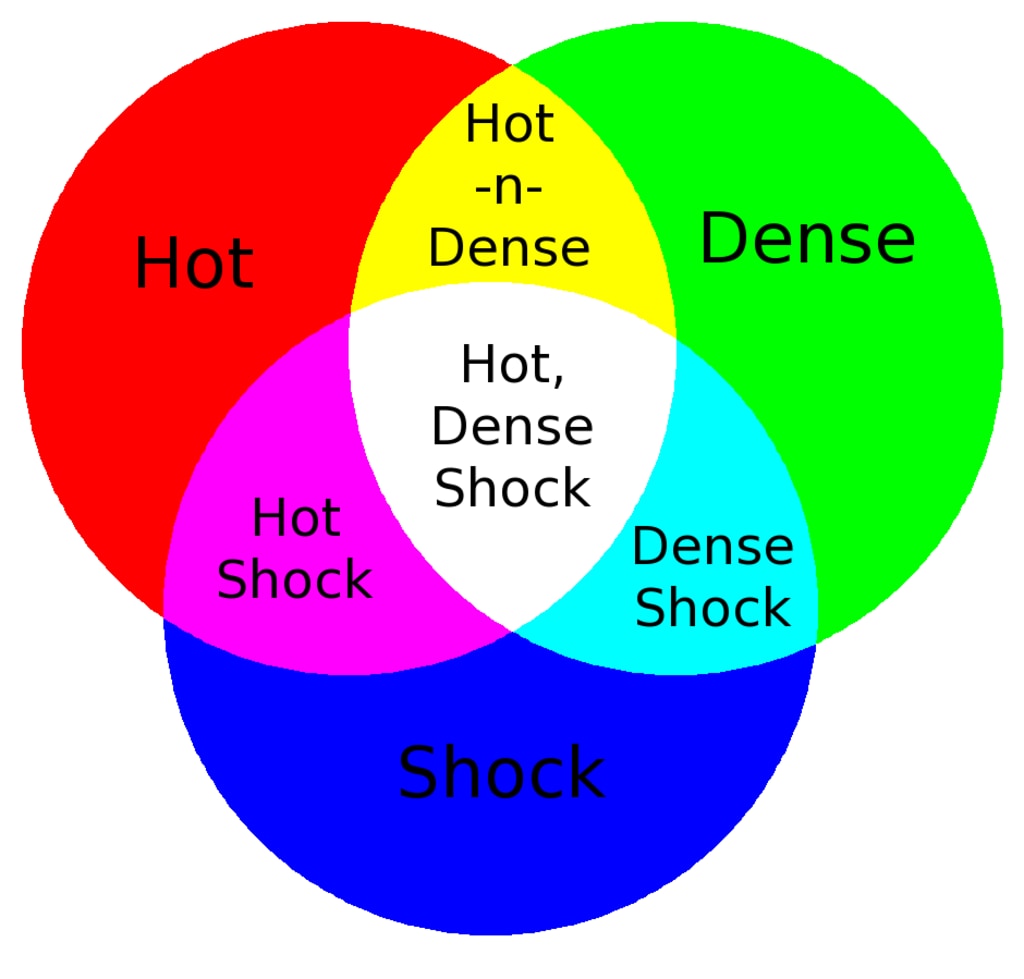
We can observe regions of interesting interactions when the three primary colors of the basic variables combine to enhance the color, represented in the tricolor diagram below. White represents a hot, dense shock, while cyan (blue-green) represents a dense shock (usually visible close to the sun), magenta (purple) represents a hot, low-density shock, while yellow indicates hot and dense material, again usually close to the sun.
CREDITS:
NASA’s Goddard Space Flight Center Scientific Visualization Studio, the Space Weather Research Center (SWRC)
and the Community-Coordinated Modeling Center (CCMC), Enlil and Dusan Odstrcil (GMU).
Tom Bridgman (GST): Lead Visualizer
M. Leila Mays (Catholic University of America): Lead Scientist
Genna Duberstein (USRA): Lead Producer
Karen Fox (ASI): Writer
Three different variables are presented from the model – temperature, density, and pressure gradient, simultaneously, using the red, green and blue color channels of the color image.
The density of the solar wind (green) flowing outward from the sun decreases as it spreads out. The temperature stays roughly constant as the solar wind material spreads through the solar system. We see the Parker spiral imprinted on the outflow from the spinning sun, much like the outflow from a spinning water sprinkler. We also see the strong density gradients (blue) created by coronal mass ejections and other shocks, propagating outward from the sun in the solar wind.
We can observe regions of interesting interactions when the three primary colors of the basic variables combine to enhance the color, represented in the tricolor diagram below. White represents a hot, dense shock, while cyan (blue-green) represents a dense shock (usually visible close to the sun), magenta (purple) represents a hot, low-density shock, while yellow indicates hot and dense material, again usually close to the sun.


NASA’s Scientific Visualization Studio
Tom Bridgman (GST): Lead Visualizer
M. Leila Mays (Catholic University of America): Lead Scientist
Genna Duberstein (USRA): Producer
Laurence Schuler (ADNET): Technical Support
Ian Jones (ADNET): Technical Support
